A Classic Thesis Style - Johannes Gutenberg-Universität Mainz
A Classic Thesis Style - Johannes Gutenberg-Universität Mainz
A Classic Thesis Style - Johannes Gutenberg-Universität Mainz

Create successful ePaper yourself
Turn your PDF publications into a flip-book with our unique Google optimized e-Paper software.
112 noise and radiation damage<br />
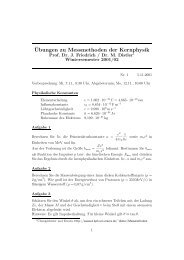
Pulse height (mV)<br />
0<br />
-20<br />
-40<br />
-60<br />
-80<br />
-100<br />
-120<br />
-140<br />
-160<br />
0 50 100 150 200 250 300 350 400 450<br />
Time (ns)<br />
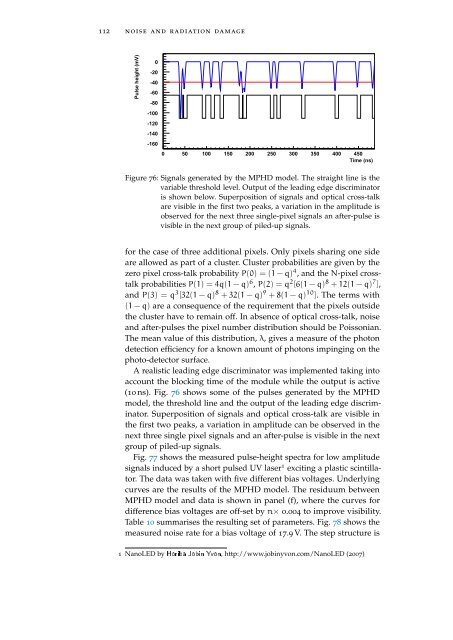
Figure 76: Signals generated by the MPHD model. The straight line is the<br />
variable threshold level. Output of the leading edge discriminator<br />
is shown below. Superposition of signals and optical cross-talk<br />
are visible in the first two peaks, a variation in the amplitude is<br />
observed for the next three single-pixel signals an after-pulse is<br />
visible in the next group of piled-up signals.<br />
for the case of three additional pixels. Only pixels sharing one side<br />
are allowed as part of a cluster. Cluster probabilities are given by the<br />
zero pixel cross-talk probability P(0) = (1 − q) 4 , and the N-pixel crosstalk<br />
probabilities P(1) = 4q(1 − q) 6 , P(2) = q 2 [6(1 − q) 8 + 12(1 − q) 7 ],<br />
and P(3) = q 3 [32(1 − q) 8 + 32(1 − q) 9 + 8(1 − q) 10 ]. The terms with<br />
(1 − q) are a consequence of the requirement that the pixels outside<br />
the cluster have to remain off. In absence of optical cross-talk, noise<br />
and after-pulses the pixel number distribution should be Poissonian.<br />
The mean value of this distribution, λ, gives a measure of the photon<br />
detection efficiency for a known amount of photons impinging on the<br />
photo-detector surface.<br />
A realistic leading edge discriminator was implemented taking into<br />
account the blocking time of the module while the output is active<br />
(10 ns). Fig. 76 shows some of the pulses generated by the MPHD<br />
model, the threshold line and the output of the leading edge discriminator.<br />
Superposition of signals and optical cross-talk are visible in<br />
the first two peaks, a variation in amplitude can be observed in the<br />
next three single pixel signals and an after-pulse is visible in the next<br />
group of piled-up signals.<br />
Fig. 77 shows the measured pulse-height spectra for low amplitude<br />
signals induced by a short pulsed UV laser 1 exciting a plastic scintillator.<br />
The data was taken with five different bias voltages. Underlying<br />
curves are the results of the MPHD model. The residuum between<br />
MPHD model and data is shown in panel (f), where the curves for<br />
difference bias voltages are off-set by n× 0.004 to improve visibility.<br />
Table 10 summarises the resulting set of parameters. Fig. 78 shows the<br />
measured noise rate for a bias voltage of 17.9 V. The step structure is<br />
1 NanoLED by ������ ����� ����, http://www.jobinyvon.com/NanoLED (2007)