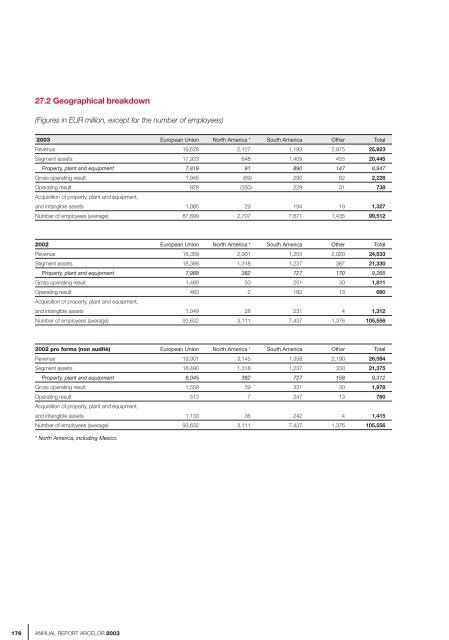
27.2 Geographical breakdown(Figures in EUR million, except for the number of employees)<strong>2003</strong> European Union North America * South America Other TotalRevenue 19,628 2,127 1,193 2,975 25,923Segment assets 17,933 648 1,409 455 20,445Property, plant and equipment 7,819 91 890 147 8,947Gross operating result 1,945 (69) 290 62 2,228Operating result 828 (350) 229 31 738Acquisition of property, plant and equipment,and intangible assets 1,085 29 194 19 1,327Number of employees (average) 87,699 2,707 7,671 1,435 99,5122002 European Union North America * South America Other TotalRevenue 18,359 2,901 1,253 2,020 24,533Segment assets 18,388 1,318 1,237 387 21,330Property, plant and equipment 7,989 382 727 170 9,268Gross operating result 1,480 50 251 30 1,811Operating result 483 2 182 13 680Acquisition of property, plant and equipment,and intangible assets 1,049 28 231 4 1,312Number of employees (average) 93,632 3,111 7,437 1,376 105,5562002 pro forma (non audité) European Union North America * South America Other TotalRevenue 19,901 3,145 1,358 2,190 26,594Segment assets 18,490 1,318 1,237 330 21,375Property, plant and equipment 8,045 382 727 158 9,312Gross operating result 1,558 59 331 30 1,978Operating result 513 7 247 13 780Acquisition of property, plant and equipment,and intangible assets 1,133 36 242 4 1,415Number of employees (average) 93,632 3,111 7,437 1,376 105,556* North America, including Mexico.176<strong>ANNUAL</strong> <strong>REPORT</strong> <strong>ARCELOR</strong> <strong>2003</strong>
NOTE 28 – EVENTS AFTER THE BALANCE SHEET DATEThe Annual General Meeting of Aceralia shareholders ofJanuary 8, 2004 decided to proceed to a public offeringof own shares at a price of EUR 17 per share, payablein cash. The offer price was confirmed on January 20,2004 by the “Comision Naciónal del Mercado de Valores(CNMV)”, the Spanish market’s supervisory body. Thepublic offering was launched on January 22, 2004, for aperiod of one month. The offer covered 6,207,261 Aceraliashares, which is equivalent to 4.97% of the capital.At the end of the offer, 5,006,342 shares were acquiredby Aceralia, which represents a success rate of 80.65%.The breakdown of the Aceralia capital is thus as follows:Arcelor (95.03%), own shares (4.01%) and other minorityshareholders (0.96%).Given that voting rights on own shares (totalling1,200,919 shares) are suspended, the percentageof control retained by Arcelor (which owns 117,792,739of a total of 119,993,658 shares) is 99.00%. Shareswere delisted from the Spanish stock market on March 2,2004. Aceralia intends to allow minority shareholderswho did not participate in the public offering to sell theirshares on an individual basis.In the context of the strengthening of the Group balancesheet and the reduction in the costs of servicing debt,Arcelor has determined to proceed with the redemptionof the O.C.E.A.N.E. 3% instruments maturing onJanuary 1, 2006 since the conditions for reimbursementare fulfilled. These O.C.E.A.N.E. instruments representEUR 350 million at the end of December <strong>2003</strong>.O.C.E.A.N.E. holders had the option, until and includingMarch 11, 2004, to exercise their rights to convert theirbonds into shares. The resulting share requirement wasmet by making available shares that were held by theGroup, with retroactive effect to January 1, 2004. At theend of this offer, which serves to reinforce theconsolidated own funds of the Group, 22,490,577O.C.E.A.N.E., i.e. 81.05% of the original issue, wereexchanged for shares.The Arcelor group signed an agreement with BagoetaS.L., the majority shareholder of Conducciones yDerivados S.A., with a view to a disposal of the Group’stubes business. The transaction cannot be finalised untilapproved by the relevant competition authorities as wellas the finalisation of the associated legal documentation.Furthermore, the Group has announced its intention tosell a major part of its American subsidiary J&L SpecialtySteel LLC to Allegheny Technologies. The transactioncould be finalised by May 3, 2004, subject to a newagreement being signed with the workers unions and tothe approval of Allegheny’s creditors and the relevantcompetition authorities.On March 15, 2004, the Group put into place aprogramme of Level I American Depositary Receipts(“ADRs”), in order to improve the liquidity of Arcelor’sshares and increase their distribution amongst nonqualifiedAmerican investors. ADRs are certificatesissued by a depositary bank, representing shares in anon-American company (American Depositary Shares,“ADSs”). They confer voting rights as well as the right todividend receipts to their holders. They give Americaninvestors access to Arcelor’s shares by means of the“Over the Counter” market, on which ADRs are freelytradable.Finally, on March 19, 2004, the Group announced thedisposal of the entirety of its participation (96%) in theshare capital of Thainox Steel Ltd. in Thailand.financial information > consolidated financial statements<strong>ANNUAL</strong> <strong>REPORT</strong> <strong>ARCELOR</strong> <strong>2003</strong> 177
- Page 1:
ANNUAL REPORT ARCELOR 2003ANNUAL RE
- Page 4 and 5:
Message from the Chairman ofthe Boa
- Page 6 and 7:
Message from the Chairman ofthe Man
- Page 8 and 9:
Does this mean that the Group is en
- Page 10 and 11:
8ANNUAL REPORT ARCELOR 2003
- Page 12 and 13:
Portrait of the GroupArcelor was bo
- Page 14 and 15:
The Arcelor/Nippon Steel Corporatio
- Page 16 and 17:
Key Figures for 2003Revenues (1) Re
- Page 18 and 19:
2003 highlightsOn January 24, 2003,
- Page 20 and 21:
Corporate GovernanceBoard of Direct
- Page 22 and 23:
Report of the Chairman of the Board
- Page 24 and 25:
Role and authority of the Board of
- Page 26 and 27:
4.2. The Audit Committee andthe App
- Page 28 and 29:
AuthorityThe powers of the Manageme
- Page 30 and 31:
B. Internal Control Procedures1. GO
- Page 32 and 33:
3.3. Internal control procedures go
- Page 34 and 35:
Information regarding capital, mark
- Page 36 and 37:
Market informationListingArcelor sh
- Page 38 and 39:
Information policyArcelor intends t
- Page 40 and 41:
38ANNUAL REPORT ARCELOR 2003
- Page 42 and 43:
table of contents >Flat Carbon Stee
- Page 44 and 45:
Within this context, and in order t
- Page 46 and 47:
3.3. Packaging steelsThe packaging
- Page 48 and 49:
table of contents >Long Carbon Stee
- Page 50 and 51:
3. THE SECTOR’S PRODUCTS ANDMARKE
- Page 52 and 53:
table of contents >Stainless Steels
- Page 54 and 55:
The distribution of the UGINE & ALZ
- Page 56 and 57:
The adaptation plan - industrial re
- Page 58 and 59:
table of contents >Distribution-Pro
- Page 60 and 61:
2. ORGANISATION OF THE SECTORThe ye
- Page 62 and 63:
Other ActivitiesThe “Other Activi
- Page 64 and 65:
62ANNUAL REPORT ARCELOR 2003
- Page 66 and 67:
Group Consolidated Management Repor
- Page 68 and 69:
Trends in global crude steel produc
- Page 70 and 71:
Financial highlights for the GroupI
- Page 72 and 73:
Return on capital employed (ROCE) b
- Page 74 and 75:
BUSINESS BY SECTORFlat Carbon Steel
- Page 76 and 77:
Even though shipments in 2003 in th
- Page 78 and 79:
From a financial standpoint, and ex
- Page 80 and 81:
The Trading and Distribution busine
- Page 82 and 83:
- in September 2003, the sale of th
- Page 84 and 85:
The market tightness provoked by th
- Page 86 and 87:
Risk ManagementGeneral legal risks
- Page 88 and 89:
Group purchasing performanceIn addi
- Page 90 and 91:
88ANNUAL REPORT ARCELOR 2003
- Page 92 and 93:
Implementation of the Sustainable D
- Page 94 and 95:
Arcelor’s principles Principal ac
- Page 96 and 97:
Organisation of Sustainable Develop
- Page 98 and 99:
indicators 2002 2003Principle 4 - O
- Page 100 and 101:
Group profitabilityObjectives• Av
- Page 102 and 103:
Arcelor Health and Safety policyArc
- Page 104 and 105:
Safety certificationsSeveral Arcelo
- Page 106 and 107:
Arcelor Environmental PolicyArcelor
- Page 108 and 109:
Implementation of a monitoring plan
- Page 110 and 111:
Dialogue with all stakeholdersObjec
- Page 112 and 113:
Dialogue with societyArcelor partic
- Page 114 and 115:
Development of individual interview
- Page 116 and 117:
Scientific CouncilChairman:• Marc
- Page 118 and 119:
Corporate governanceObjectives• E
- Page 120 and 121:
SponsorshipEvery year, the various
- Page 122 and 123:
Durability: Manufacturers are now a
- Page 124 and 125:
122ANNUAL REPORT ARCELOR 2003
- Page 126 and 127:
GENERAL INFORMATION ABOUTARCELORCor
- Page 128 and 129: Cold-rolled flat products: In 2001,
- Page 130 and 131: Safeguard clause• United States:
- Page 132 and 133: 130ANNUAL REPORT ARCELOR 2003
- Page 134 and 135: Consolidated financial statementsof
- Page 136 and 137: CONSOLIDATED CASH FLOW STATEMENTIn
- Page 138 and 139: NOTES TO THE CONSOLIDATED FINANCIAL
- Page 140 and 141: Assets intended to be disposed of o
- Page 142 and 143: AmortisationAmortisation is recogni
- Page 144 and 145: 13) EquityRepurchase of share capit
- Page 146 and 147: 18) Other provisionsA provision is
- Page 148 and 149: The major changes in the consolidat
- Page 150 and 151: NOTE 4 - INTANGIBLE ASSETSGoodwill
- Page 152 and 153: NOTE 5 - PROPERTY, PLANT AND EQUIPM
- Page 154 and 155: NOTE 7 - OTHER INVESTMENTSThe main
- Page 156 and 157: NOTE 13 - EQUITY13.1 Issued capital
- Page 158 and 159: NOTE 15 - MINORITY INTERESTSIn the
- Page 160 and 161: 16.6 Detail of main individual long
- Page 162 and 163: 17.2.2 Additional pension plansFran
- Page 164 and 165: 17.2.3 Leaving indemnities (continu
- Page 166 and 167: 18.2 Early retirement plansAn actua
- Page 168 and 169: NOTE 22 - NET FINANCING RESULTIn EU
- Page 170 and 171: NOTE 24 - RELATED PARTY DISCLOSURES
- Page 172 and 173: The portfolio of financial instrume
- Page 174 and 175: NOTE 26 - COMMITMENTS GIVEN AND REC
- Page 176 and 177: 27.1 Breakdown by activity (continu
- Page 180 and 181: NOTE 29 - RECONCILIATION OF THE ARC
- Page 182 and 183: Company name Consolidation Country
- Page 184 and 185: Company name Consolidation Country
- Page 186 and 187: Company name Consolidation Country
- Page 188 and 189: Company name Consolidation Country
- Page 190 and 191: Company name Consolidation Country
- Page 192 and 193: Audit31, Allée Scheffer Telephone
- Page 194 and 195: Annual accounts Arcelor S.A.ANNUAL
- Page 196 and 197: INCOME STATEMENT FROM JANUARY 1 TO
- Page 198 and 199: NOTE 3 - STATEMENT OF TANGIBLE FIXE
- Page 200 and 201: NOTE 8 - PROVISIONS FOR LIABILITIES
- Page 202 and 203: NOTE 14 - DIRECTORS’ REMUNERATION
- Page 204 and 205: Arcelor Ordinary General Meeting on
- Page 206 and 207: GlossaryAnnealing:The heat treatmen
- Page 208 and 209: How steel is made?a 3-stage process
- Page 210 and 211: Arcelor’s main steel-manufacturin
- Page 212 and 213: NOTES210ANNUAL REPORT ARCELOR 2003
- Page 214: Concept and realization133, avenue