Financial Statements - The United Basalt Products Ltd
Financial Statements - The United Basalt Products Ltd
Financial Statements - The United Basalt Products Ltd

Create successful ePaper yourself
Turn your PDF publications into a flip-book with our unique Google optimized e-Paper software.
<strong>Financial</strong> <strong>Statements</strong><br />
Year ended June 30, 2009 (cont’d...)<br />
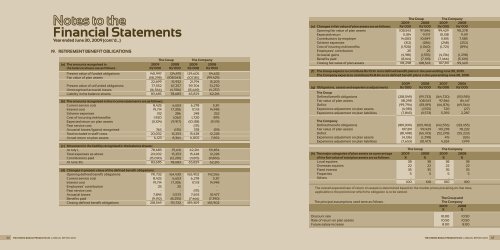
19. RETIREMENT BENEFIT OBLIGATIONS<br />
<strong>The</strong> Group <strong>The</strong> Company<br />
(a) <strong>The</strong> amounts recognised in 2009 2008 2009 2008<br />
the balance sheets are as follows : Rs’000 Rs’000 Rs’000 Rs’000<br />
Present value of funded obligations 140,997 124,475 129,605 114,632<br />
Fair value of plan assets (118,298) (108,543) (107,811) (99,429)<br />
22,699 15,932 21,794 15,203<br />
Present value of unfunded obligations 77,552 67,257 59,704 51,270<br />
Unrecognised actuarial losses (16,566) (4,506) (15,669) (4,257)<br />
Liability in the balance sheets 83,685 78,683 65,829 62,216<br />
(b) <strong>The</strong> amounts recognised in the income statements are as follows :<br />
Current service cost 8,425 6,653 6,278 5,311<br />
Interest cost 19,714 17,306 17,113 14,948<br />
Scheme expenses 312 286 248 252<br />
Cost of incurring risk benefits 1,920 1,060 1,720 895<br />
Expected return on plan assets (11,104) (9,917) (10,138) (9,119)<br />
Past service cost - - (171) -<br />
Actuarial losses/(gains) recognised 765 (135) 378 (59)<br />
Total included in staff costs 20,032 15,253 15,428 12,228<br />
Actual return on plan assets 6,123 8,364 6,002 7,892<br />
(c ) Movement in the liability recognised in the balance sheets :<br />
At July 1, 78,683 75,631 62,216 59,854<br />
Total expenses as above 20,032 15,253 15,428 12,228<br />
Contributions paid (15,030) (12,201) (11,815) (9,866)<br />
At June 30, 83,685 78,683 65,829 62,216<br />
(d) Changes in present value of the defined benefit obligations:<br />
Opening defined benefit obligations 191,732 164,430 165,902 142,556<br />
Current service cost 8,425 6,653 6,278 5,311<br />
Interest cost 19,714 17,306 17,113 14,948<br />
Employees’ contribution 25 25 - -<br />
Past service cost - - (171) -<br />
Actuarial losses 7,845 11,573 7,653 10,477<br />
Benefits paid (9,192) (8,255) (7,466) (7,390)<br />
Closing defined benefit obligations 218,549 191,732 189,309 165,902<br />
<strong>The</strong> Group <strong>The</strong> Company<br />
2009 2008 2009 2008<br />
(e) Changes in fair value of plan assets are as follows: Rs’000 Rs’000 Rs’000 Rs’000<br />
Opening fair value of plan assets 108,543 97,846 99,429 90,278<br />
Expected return 11,104 9,917 10,138 9,119<br />
Contributions by employer 14,003 10,849 11,815 7,585<br />
Scheme expenses (312) (286) (248) (252)<br />
Cost of insuring risk benefits (1,920) (1,060) (1,721) (894)<br />
Employees’ contribution 25 25 - -<br />
Actuarial gains (4,981) (1,555) (4,136) (1,298)<br />
Benefits paid (8,164) (7,193) (7,466) (5,109)<br />
Closing fair value of plan assets 118,298 108,543 107,811 99,429<br />
(f) <strong>The</strong> Group expects to contribute Rs 10.1m to its defined benefit plans in the year ending June 30, 2010.<br />
<strong>The</strong> Company expects to contribute Rs 8.4m to its defined benefit plans in the year ending June 30, 2010.<br />
2009 2008 2007 2006<br />
(g) Obligations, assets and experience adjustments<br />
<strong>The</strong> Group<br />
Rs’000 Rs’000 Rs’000 Rs’000<br />
Defined benefit obligations (218,549) (191,732) (164,720) (153,981)<br />
Fair value of plan assets 118,298 108,543 97,846 84,417<br />
Deficit (99,794) (83,189) (66,874) (69,564)<br />
Experience adjustment on plan assets (4,981) (1,555) 720 (27)<br />
Experience adjustment on plan liabilities (7,845) (11,573) 5,359 2,287<br />
<strong>The</strong> Company<br />
Defined benefit obligations (189,309) (165,902) (142,556) (133,455)<br />
Fair value of plan assets 107,811 99,429 90,278 78,232<br />
Deficit (81,498) (66,473) (52,278) (55,223)<br />
Experience adjustment on plan assets (4,136) (1,298) 415 (126)<br />
Experience adjustment on plan liabilities (7,653) (10,477) 4,554 1,999<br />
<strong>The</strong> Group <strong>The</strong> Company<br />
(h) <strong>The</strong> major categories of plan assets as a percentage 2009 2008 2009 2008<br />
of the fair value of total plan assets are as follows: % % % %<br />
Local equities 38 38 38 38<br />
Overseas equities 22 22 22 22<br />
Fixed interest 35 35 35 35<br />
Properties 5 5 5 5<br />
Others - - - -<br />
100 100 100 100<br />
<strong>The</strong> overall expected rate of return on assets is determined based on the market prices prevailing on that date,<br />
applicable to the period over which the obligation is to be settled.<br />
<strong>The</strong> Group and<br />
<strong>The</strong> principal assumptions used were as follows : <strong>The</strong> Company<br />
2009 2008<br />
% %<br />
Discount rate 10.00 10.50<br />
Rate of return on plan assets 10.50 10.50<br />
Future salary increase 8.00 8.00<br />
66 THE UNITED BASALT PRODUCTS LTD | ANNUAL REPORT 2009 THE UNITED BASALT PRODUCTS LTD | ANNUAL REPORT 2009 67