MDG Watch - NSCB
MDG Watch - NSCB
MDG Watch - NSCB

Create successful ePaper yourself
Turn your PDF publications into a flip-book with our unique Google optimized e-Paper software.
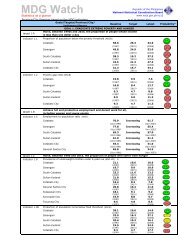
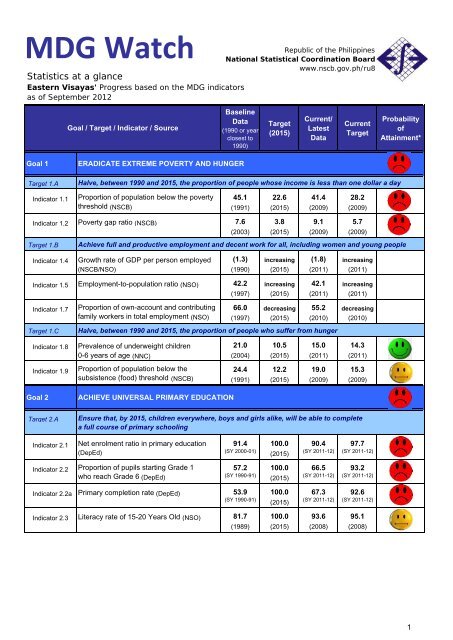
<strong>MDG</strong> <strong>Watch</strong>Statistics at a glanceEastern Visayas' Progress based on the <strong>MDG</strong> indicatorsas of September 2012Republic of the PhilippinesNational Statistical Coordination Boardwww.nscb.gov.ph/ru8Goal / Target / Indicator / SourceBaselineData(1990 or yearclosest to1990)Target(2015)Current/LatestDataCurrentTargetProbabilityofAttainment*Goal 1Target 1.AERADICATE EXTREME POVERTY AND HUNGERHalve, between 1990 and 2015, the proportion of people whose income is less than one dollar a dayIndicator 1.1Proportion of population below the povertythreshold (<strong>NSCB</strong>)45.1 22.6 41.4 28.2(1991) (2015) (2009) (2009)Indicator 1.2Target 1.BIndicator 1.4Indicator 1.5Indicator 1.7Target 1.CIndicator 1.8Indicator 1.9Goal 2Poverty gap ratio (<strong>NSCB</strong>) 7.6 3.8 9.1 5.7(2003) (2015) (2009) (2009)Achieve full and productive employment and decent work for all, including women and young peopleGrowth rate of GDP per person employed (1.3) increasing (1.8) increasing(<strong>NSCB</strong>/NSO) (1990) (2015) (2011) (2011)Employment-to-population ratio (NSO) 42.2 increasing 42.1 increasingProportion of own-account and contributingfamily workers in total employment (NSO)(1997) (2015) (2011) (2011)66.0 decreasing 55.2 decreasing(1997) (2015) (2010) (2010)Halve, between 1990 and 2015, the proportion of people who suffer from hungerPrevalence of underweight children 21.0 10.5 15.0 14.30-6 years of age (NNC) (2004) (2015) (2011) (2011)Proportion of population below thesubsistence (food) threshold (<strong>NSCB</strong>)ACHIEVE UNIVERSAL PRIMARY EDUCATION24.4 12.2 19.0 15.3(1991) (2015) (2009) (2009)Target 2.AEnsure that, by 2015, children everywhere, boys and girls alike, will be able to completea full course of primary schoolingIndicator 2.1Net enrolment ratio in primary education(DepEd)91.4 100.0 90.4 97.7(SY 2000-01)(SY 2011-12) (SY 2011-12)(2015)Indicator 2.2 Proportion of pupils starting Grade 1who reach Grade 6 (DepEd)57.2 100.0 66.5 93.2(SY 1990-91)(SY 2011-12) (SY 2011-12)(2015)Indicator 2.2aIndicator 2.3Primary completion rate (DepEd) 53.9 100.0 67.3 92.6(SY 1990-91)(2015)(SY 2011-12) (SY 2011-12)Literacy rate of 15-20 Years Old (NSO) 81.7 100.0 93.6 95.1(1989) (2015) (2008) (2008)1
Goal / Target / Indicator / SourceBaselineData(1990 or yearclosest to1990)Target(2015)Current/LatestDataCurrentTargetProbabilityofAttainment*Goal 3PROMOTE GENDER EQUALITY AND EMPOWER WOMENTarget 3.A Eliminate gender disparity in primary and secondary education, preferably by 2005,and to all levels of education no later than 2015Indicator 3.1aIndicator 3.1bIndicator 3.1cIndicator 3.3Goal 4Ratio of girls to boys in primary education(DepEd)Ratio of girls to boys in secondaryeducation (DepEd)Ratio of literate females to males15-20 years old (NSO)Proportion of seats held by women in localpolitics (DILG)REDUCE CHILD MORTALITY1.002 1.000 1.090 1.001(SY 2002-03)(SY 2011-12) (SY 2011-12)(2015)1.147 1.000 0.970 1.045(SY 2002-03)(SY 2011-12) (SY 2011-12)(2015)1.063 1.000 1.030 1.017(1989) (2015) (2008) (2008)15.4 50.0 25.4 41.4(1995) (2015) (2010) (2010)Target 4.AIndicator 4.1Indicator 4.2Indicator 4.3Goal 5Target 5.AIndicator 5.1Indicator 5.2Target 5.BIndicator 5.3Indicator 5.5Indicator 5.6Goal 6Target 6.AIndicator 6.2Reduce by two-thirds, between 1990 and 2015, the under-five mortality rateUnder-five mortality rate (NSO) 98.0 32.7 53.0 44.5(1993) (2015) (2011) (2011)Infant mortality rate (NSO) 61.0 20.3 40.0 27.7Proportion of 1 year old children immunizedagainst measles (DOH)IMPROVE MATERNAL HEALTH(1993) (2015) (2011) (2011)80.6 100.0 78.5 96.9(1990) (2015) (2011) (2011)Reduce by three-quarters, between 1990 and 2015, the maternal mortality ratioMaternal mortality ratio (<strong>NSCB</strong>/DOH) 225.9 56.5 79.0 83.6Proportion of births attended by skilledhealth personnel (DOH)Achieve, by 2015, universal access to reproductive health(1990) (2015) (2011) (2011)61.6 100.0 75.8 93.9(1990) (2015) (2011) (2011)Contraceptive prevalence rate (NSO) 35.9 100.0 47.5 88.3(1993) (2015) (2011) (2011)Antenatal care coverage (NSO) 82.0 100.0 77.3 96.7(1993) (2015) (2011) (2011)Unmet need for family planning (NSO) 36.0 decreasing 18.6 decreasingCOMBAT HIV/AIDS, MALARIA AND OTHER DISEASESHave halted by 2015 and begun to reverse the spread of HIV/AIDSCondom use rate of the contraceptiveprevalence rate (NSO)(1993) (2015) (2011) (2011)1.2 increasing 1.4 increasing(2003) (2015) (2008) (2008)2
Goal / Target / Indicator / SourceBaselineData(1990 or yearclosest to1990)Target(2015)Current/LatestDataCurrentTargetProbabilityofAttainment*Target 6.CHave halted by 2015 and begun to reverse the incidence of malaria and other diseasesIndicator 6.9Death rate associated with tuberculosis(DOH)33.1 0.0 24.1 8.8(2000) (2015) (2011) (2011)Indicator 6.10aIndicator 6.10bProportion of tuberculosis cases detectedunder directly observed treatment shortcourse (DOH)Proportion of tuberculosis cases curedunder directly observed treatment shortcourse (DOH)75.0 0.0 72.0 37.5(2007) (2015) (2011) (2011)83.0 100.0 83.8 91.5(2007) (2015) (2011) (2011)Goal 7Target 7.BENSURE ENVIRONMENTAL SUSTAINABILITYReduce biodiversity loss, achieving, by 2010, a significant reduction in the rate of lossIndicator 7.6Target 7.CProportion of species threatened withextinction (DENR)9.9 decreasing 19.8 decreasing(1990) (2015) (2010) (2010)Halve, by 2015, the proportion of people without sustainable access to safe drinkingwater and basic sanitationIndicator 7.7Proportion of households with access tosafe water supply (NSO)65.1 82.6 83.8 77.7(1990) (2015) (2008) (2008)Indicator 7.8Target 7.DIndicator 7.9Proportion of households with sanitary toiletfacility (NSO)51.7 75.9 77.4 69.1(1990) (2015) (2008) (2008)By 2020, to have achieved a significant improvement in the lives of at least 100 millionslum dwellersProportion of households with 91.7 100.0 71.7 97.7access to secure tenure (NSO) (1990) (2015) (2008) (2008)* based on comparison of actual (from baseline to latest data) and required (from baseline to target year) rates of progress ofMillennium Development Goals (<strong>MDG</strong>)Probability of Attaining the GoalLow ; Pace of progress is less than 0.5Medium ; Pace of progress is between 0.5 and 0.9High ; Pace of progress is greater than 0.9For your inquires and other information needs, visit or call the:NATIONAL STATISTICAL INFORMATION CENTERNATIONAL STATISTICAL COORDINATION BOARD REGIONAL DIVISION VIIIG/F Calzita Bldg., No. 143 P. Zamora Street, Tacloban CityTelefax No. (053) 325-7508URL: www.nscb.gov.ph/ru8E-mail Address: nscbru8@yahoo.com3
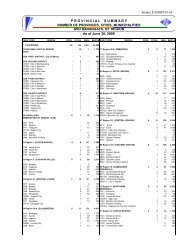
<strong>MDG</strong> <strong>Watch</strong>Republic of the PhilippinesNational Statistical Coordination Boardwww.nscb.gov.ph/ru8Statistics at a glanceEastern Visayas Provinces and Cities' Progress based on the <strong>MDG</strong> indicatorsas of September 2012Goal / Target / Indicator / Source /Province / CityBaselineData(1990 or yearclosest to1990)Target(2015)Current/LatestDataCurrentTargetProbabilityofAttainmentGoal 1ERADICATE EXTREME POVERTY AND HUNGERTarget 1.AHalve, between 1990 and 2015, the proportion of people whose income is less than one dollar a day.Indicator 1.1Proportion of population below the povertythreshold (<strong>NSCB</strong>)(2003) (2015) (2009) (2009)Biliran 38.2 19.1 34.9 28.7Eastern Samar 36.4 18.2 54.0 27.3Leyte 37.2 18.6 34.3 27.9Northern Samar 44.6 22.3 51.2 33.5Southern Leyte 37.7 18.9 43.3 28.3Samar 33.9 17.0 45.0 25.4Indicator 1.2Poverty gap ratio (<strong>NSCB</strong>)(2003) (2015)(2009) (2009)Biliran 7.9 4.0 7.2 5.9Eastern Samar 8.4 4.2 15.1 6.3Leyte 7.8 3.9 6.7 5.9Northern Samar 8.9 4.5 11.5 3.4Southern Leyte 6.8 3.4 7.6 5.1Samar 6.2 3.1 11.5 4.74
Goal / Target / Indicator / Source /Province / CityBaselineData(1990 or yearclosest to1990)Target(2015)Current/LatestDataCurrentTargetProbabilityofAttainmentTarget 1.CHalve, between 1990 and 2015, the proportion of people who suffer from hunger.Indicator 1.8Prevalence of underweight children0-6 years of age (NNC)(2004) (2015)(2011)(2011)Biliran 24.5 12.3 13.1 16.7Eastern Samar 20.1 10.1 11.8 13.7Leyte 20.1 10.1 15.8 13.7Northern Samar 29.7 14.9 17.7 20.3Southern Leyte 15.3 7.7 8.0 10.4Samar 24.0 12.0 21.5 16.4Tacloban City 3.6 1.8 9.9 2.5Ormoc City 17.6 8.8 12.6 12.0Maasin City 10.4 5.2 5.0 7.1Calbayog City 19.3 9.7 11.8 13.2Indicator 1.9Proportion of population below thesubsistence (food) threshold (<strong>NSCB</strong>)(2003) (2015)(2009)(2009)Biliran 14.3 7.2 11.8 10.7Eastern Samar 18.3 9.2 32.2 13.7Leyte 15.7 7.9 13.4 11.8Northern Samar 18.0 9.0 27.4 13.5Southern Leyte 15.4 7.7 15.6 11.6Samar 11.0 5.5 22.5 8.35
Goal / Target / Indicator / Source /Province / CityBaselineData(1990 or yearclosest to1990)Target(2015)Current/LatestDataCurrentTargetProbabilityofAttainmentGoal 2ACHIEVE UNIVERSAL PRIMARY EDUCATIONTarget 2.AEnsure that, by 2015, children everywhere, boys and girls alike, will be able to completea full course of primary schooling.Indicator 2.1Net enrolment ratio in primary education(DepEd)(SY 2002-03) (2015)(SY 2011-12)(SY 2011-12)Biliran 87.1 100.0 92.5 96.0Eastern Samar 88.3 100.0 95.3 96.4Leyte 82.1 100.0 91.4 94.5Northern Samar 85.4 100.0 94.2 95.5Southern Leyte 81.4 100.0 81.2 94.3Samar 90.4 100.0 96.9 97.0Tacloban City 71.8 100.0 74.8 91.3Ormoc City 86.0 100.0 78.3 95.7Maasin City 69.0 100.0 79.7 90.5Calbayog City 80.9 100.0 86.5 94.1Indicator 2.2Proportion of pupils starting grade 1who reach grade 6 (DepEd)(SY 2002-03)(2015)(SY 2011-12) (SY 2011-12)Biliran 73.4 100.0 82.5 91.8Eastern Samar 54.4 100.0 49.1 86.0Leyte 68.2 100.0 77.4 90.2Northern Samar 65.4 100.0 51.1 89.4Southern Leyte 93.0 100.0 83.7 97.8Samar 60.6 100.0 65.7 87.9Tacloban City 65.3 100.0 79.3 89.3Ormoc City 67.5 100.0 83.8 90.0Maasin City 70.5 100.0 83.2 90.9Calbayog City 40.9 100.0 61.6 81.86
Goal / Target / Indicator / Source /Province / CityBaselineData(1990 or yearclosest to1990)Target(2015)Current/LatestDataCurrentTargetProbabilityofAttainmentIndicator 2.2aPrimary completion rate (DepEd)(SY 2002-03)(2015) (SY 2011-12) (SY 2011-12)Biliran 67.2 100.0 74.3 89.9Eastern Samar 53.1 100.0 66.4 85.6Leyte 65.7 100.0 67.1 89.4Northern Samar 61.0 100.0 59.7 88.0Southern Leyte 90.4 100.0 78.3 97.0Samar 58.9 100.0 67.2 87.4Tacloban City 61.1 100.0 74.4 88.0Ormoc City 64.8 100.0 74.5 89.2Maasin City 68.6 100.0 82.4 90.3Calbayog City 40.2 100.0 64.2 90.3Goal 3PROMOTE GENDER EQUALITY AND EMPOWER WOMENTarget 3.A Eliminate gender disparity in primary and secondary education, preferably by 2005,and to all levels of education no later than 2015.Ratio of girls to boys in primary educationIndicator 3.1a (SY 2002-03)(DepEd)(2015)(SY 2011-12)(SY 2011-12)Biliran 0.991 1.000 1.080 0.997Eastern Samar 0.985 1.000 1.100 0.995Leyte 0.996 1.000 1.090 0.999Northern Samar 1.012 1.000 1.090 1.004Southern Leyte 0.960 1.000 1.120 0.998Samar 1.031 1.000 1.090 0.993Tacloban City 1.019 1.000 1.090 0.992Ormoc City 1.004 1.000 1.080 1.001Maasin City 1.018 1.000 1.120 1.006Calbayog City 1.040 1.000 1.100 1.0127
Goal / Target / Indicator / Source /Province / CityBaselineData(1990 or yearclosest to1990)Target(2015)Current/LatestDataCurrentTargetProbabilityofAttainmentIndicator 3.1bRatio of girls to boys in secondaryeducation (DepEd)(SY 2002-03)(2015)(SY 2011-12) (SY 2011-12)Biliran 1.113 1.000 0.980 1.035Eastern Samar 1.113 1.000 1.000 1.035Leyte 1.151 1.000 0.990 1.046Northern Samar 1.181 1.000 0.900 1.056Southern Leyte 0.997 1.000 1.060 0.999Samar 1.197 1.000 0.940 1.061Tacloban City 1.261 1.000 0.950 1.080Ormoc City 1.151 1.000 0.970 1.046Maasin City 0.950 1.000 1.240 0.985Calbayog City 1.205 1.000 0.900 1.063Goal 4REDUCE CHILD MORTALITYTarget 4.AReduce by two-thirds, between 1990 and 2015, the under-five mortality rate.Indicator 4.1Under-five mortality rate (DOH)(2000) (2015) (2011)(2011)Biliran 21.4 7.1 24.0 10.9Eastern Samar 26.8 8.9 18.2 13.7Leyte 20.2 6.7 11.3 10.3Northern Samar 19.4 6.5 14.3 9.9Southern Leyte 26.1 8.7 11.3 13.4Samar 14.2 4.7 10.6 7.3Tacloban City 31.9 10.6 18.4 16.3Ormoc City 18.8 6.3 11.7 9.6Calbayog City 13.6 4.5 5.1 7.08
Goal / Target / Indicator / Source /Province / CityBaselineData(1990 or yearclosest to1990)Target(2015)Current/LatestDataCurrentTargetProbabilityofAttainmentIndicator 4.2Infant mortality rate (DOH)(1990)(2015)(2011)(2011)Biliran 22.0 7.3 17.3 9.7Eastern Samar 21.0 7.0 16.2 9.2Leyte 18.6 6.2 7.4 8.2Northern Samar 30.6 10.2 8.2 13.5Southern Leyte 23.4 7.8 8.8 10.3Samar 14.4 4.8 7.1 6.3Tacloban City 32.8 10.9 11.0 14.4Ormoc City 6.9 2.3 10.1 3.0Calbayog City 61.9 20.6 2.7 27.2Indicator 4.3Proportion of 1 year old childrenimmunized against measles (DOH)(1990)(2015) (2011) (2011)Biliran 80.6 100.0 84.0 96.9Eastern Samar 68.7 100.0 83.9 95.0Leyte 80.5 100.0 80.9 96.9Northern Samar 70.9 100.0 77.3 95.3Southern Leyte 82.7 100.0 83.3 97.2Samar 93.0 100.0 71.5 98.9Tacloban City 91.3 100.0 79.3 98.6Ormoc City 93.5 100.0 78.3 99.0Calbayog City 45.1 100.0 61.4 91.29
Goal / Target / Indicator / Source /Province / CityBaselineData(1990 or yearclosest to1990)Target(2015)Current/LatestDataCurrentTargetProbabilityofAttainmentGoal 5IMPROVE MATERNAL HEALTHTarget 5.AReduce by three-quarters, between 1990 and 2015, the maternal mortality ratio.Indicator 5.1Maternal mortality ratio (<strong>NSCB</strong>/DOH)(1990)(2015)(2011)(2011)Eastern Samar 144.9 36.2 258.0 53.6Leyte 127.2 31.8 50.0 47.1Southern Leyte 110.2 27.6 31.0 40.8Samar 228.8 57.2 52.0 84.7Tacloban City 184.8 46.2 128.0 68.4Ormoc City 99.2 24.8 66.0 36.7Calbayog City 265.6 66.4 119.0 98.3Indicator 5.2Proportion of births attended by skilledhealth personnel (DOH)(1990)(2015) (2011) (2011)Biliran 32.6 100.0 77.6 89.2Eastern Samar 66.6 100.0 79.5 94.7Leyte 64.0 100.0 84.0 94.2Northern Samar 51.0 100.0 55.8 92.2Southern Leyte 64.1 100.0 85.9 94.3Samar 68.8 100.0 58.1 95.0Tacloban City 84.4 100.0 96.4 97.5Ormoc City 43.0 100.0 75.5 90.9Maasin City 78.4 100.0 96.0 96.5Calbayog City 43.2 100.0 33.5 90.510
Goal / Target / Indicator / Source /Province / CityBaselineData(1990 or yearclosest to1990)Target(2015)Current/LatestDataCurrentTargetProbabilityofAttainmentTarget 5.BAchieve, by 2015, universal access to reproductive healthIndicator 5.3Contraceptive prevalence rate (DOH)(1997) (2015) (2011) (2011)Biliran 36.2 100.0 37.1 85.8Eastern Samar 19.3 100.0 32.3 82.1Leyte 28.5 100.0 24.4 84.1Northern Samar 8.4 100.0 19.0 79.6Southern Leyte 24.7 100.0 55.9 83.3Samar 9.9 100.0 11.0 80.0Tacloban City 8.0 100.0 36.4 79.6Ormoc City 38.4 100.0 38.3 86.3Calbayog City 44.5 100.0 20.6 87.7Indicator 5.5Antenatal care coverage (DOH) (1997)(2015) (2011)(2011)Biliran 86.4 100.0 75.7 97.0Eastern Samar 79.2 100.0 68.9 95.4Leyte 46.5 100.0 28.0 88.1Northern Samar 78.3 100.0 86.8 95.2Southern Leyte 81.1 100.0 59.6 95.8Samar 79.8 100.0 42.9 95.5Tacloban City 53.3 100.0 66.5 89.6Ormoc City 58.9 100.0 47.7 90.9Calbayog City 63.6 100.0 51.6 91.911
Goal / Target / Indicator / Source /Province / CityBaselineData(1990 or yearclosest to1990)Target(2015)Current/LatestDataCurrentTargetProbabilityofAttainmentGoal 6COMBAT HIV/AIDS, MALARIA AND OTHER DISEASESTarget 6.CHave halted by 2015 and begun to reverse the incidence of malaria and other diseases.Indicator 6.9Death rate associated with tuberculosis(DOH)(2000)(2015) (2011) (2011)Biliran 33.2 0.0 27.7 8.9Eastern Samar 41.8 0.0 23.1 11.1Leyte 32.2 0.0 22.1 8.6Northern Samar 23.9 0.0 28.9 6.4Southern Leyte 41.0 0.0 20.2 10.9Samar 33.3 0.0 10.2 8.9Tacloban City 44.3 0.0 39.5 11.8Ormoc City 44.2 0.0 53.2 11.8Calbayog City 27.6 0.0 28.3 7.4Goal / Target / Indicator / Source /Province / CityBaselineData(1990 or yearclosest to1990)Target(2015)Current/LatestDataCurrentTargetProbabilityofAttainmentIndicator 6.10aProportion of tuberculosis cases detectedunder directly observed treatment shortcourse (DOH)(2007) (2015) (2011)(2011)Eastern Samar 78.0 0.0 73.0 39.0Leyte 78.0 0.0 75.0 39.0Northern Samar 60.0 0.0 55.0 30.0Southern Leyte 85.0 0.0 82.0 42.5Samar 41.0 0.0 43.0 20.5Maasin City 91.0 0.0 79.0 45.5Calbayog City 79.0 0.0 59.0 39.512
Goal / Target / Indicator / Source /Province / CityBaselineData(1990 or yearclosest to1990)Target(2015)Current/LatestDataCurrentTargetProbabilityofAttainmentIndicator 6.10bProportion of tuberculosis cases curedunder directly observed treatment shortcourse (DOH)(2007) (2015)(2011)(2011)Biliran 91.0 100.0 96.8 95.5Eastern Samar 88.0 100.0 85.4 94.0Leyte 84.0 100.0 85.0 92.0Northern Samar 75.0 100.0 60.8 87.5Southern Leyte 89.0 100.0 91.6 94.5Samar 85.0 100.0 83.5 92.5Tacloban City 82.0 100.0 88.6 91.0Ormoc City 70.0 100.0 81.0 85.0Maasin City 82.0 100.0 86.0 91.0Calbayog City 76.0 100.0 84.8 88.0Goal 7ENSURE ENVIRONMENTAL SUSTAINABILITYTarget 7.CHalve, by 2015, the proportion of people without sustainable access to safe drinkingwater and basic sanitation.Proportion of households with access toIndicator 7.8 (1990) (2015) (2011) (2011)safe water supply (DOH)Biliran 72.2 86.1 97.6 83.9Eastern Samar 89.1 94.6 83.3 93.7Leyte 40.6 70.3 84.8 65.5Southern Leyte 95.4 97.7 77.8 97.3Samar 91.5 95.7 71.4 95.1Ormoc City 94.1 97.1 96.0 96.6Maasin City 78.3 89.1 94.1 87.4Calbayog City 67.4 83.7 63.8 81.113
Goal / Target / Indicator / Source /Province / CityBaselineData(1990 or yearclosest to1990)Target(2015)Current/LatestDataCurrentTargetProbabilityofAttainmentProportion of households with sanitaryIndicator 7.9 (1990) (2015) (2011)toilet facility (DOH)(2011)Biliran 57.7 78.9 73.0 75.5Eastern Samar 59.9 80.0 71.2 76.7Leyte 69.9 85.0 79.1 82.5Southern Leyte 77.1 88.6 88.6 86.7Samar 56.3 78.2 49.0 74.7Tacloban City 46.4 73.2 60.8 68.9Ormoc City 52.2 76.1 77.3 72.3Maasin City 56.5 78.2 84.5 74.8Calbayog City 35.3 67.7 58.2 62.5Target 7.DBy 2020, to have achieved a significant improvement in the lives of at least 100 millionslum dwellers.Indicator 7.10Proportion of households with access tosecure tenure (NSO)(1990) (2015) (2000) (2000)Biliran 92.3 100.0 81.1 95.4Eastern Samar 92.6 100.0 85.2 95.6Leyte 91.1 100.0 77.0 94.7Northern Samar 88.7 100.0 82.9 93.2Southern Leyte 95.0 100.0 83.1 97.0Samar 93.0 100.0 80.6 95.814
Notes:1. Probability of attainment is based on comparison of actual (from baseline to latest data) and required (from baseline to target year)rates of progress of Millennium Development Goals (<strong>MDG</strong>)2. Baseline data for Maasin City is 2003.Probability of Attaining the GoalLow ; Pace of progress is less than 0.5Medium ; Pace of progress is between 0.5 and 0.9High ; Pace of progress is greater than 0.9Sources of DataDepEdDOH-CHDNNC<strong>NSCB</strong>NSODepartment of EducationDepartment of Health Center for Health DevelopmentNational Nutrition CouncilNational Statistical Coordination BoardNational Statistics OfficeFor your inquiries and other information needs, visit or call the:NATIONAL STATISTICAL INFORMATION CENTER Telefax No. (053) 325-7508NATIONAL STATISTICAL COORDINATION BOARD REGIONAL DIVISION VIIIURL: www.nscb.gov.ph/ru8G/F Calzita Bldg., No. 143 P. Zamora Street, Tacloban CityE-mail Address: nscbru8@yahoo.com15