Q3 2011 - NSCB
Q3 2011 - NSCB
Q3 2011 - NSCB
You also want an ePaper? Increase the reach of your titles
YUMPU automatically turns print PDFs into web optimized ePapers that Google loves.
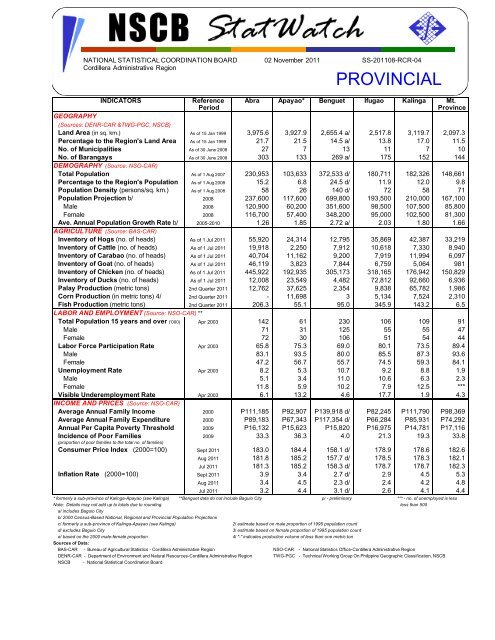
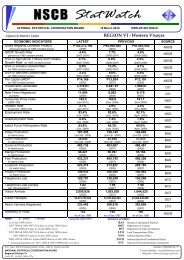
NATIONAL STATISTICAL COORDINATION BOARD 02 November <strong>2011</strong> SS-<strong>2011</strong>08-RCR-04Cordillera Administrative RegionPROVINCIALINDICATORS Reference Abra Apayao* Benguet Ifugao Kalinga Mt.PeriodProvinceGEOGRAPHY(Sources: DENR-CAR &TWG-PGC, <strong>NSCB</strong>)Land Area (in sq. km.) As of 15 Jan 1999 3,975.6 3,927.9 2,655.4 a/ 2,517.8 3,119.7 2,097.3Percentage to the Region's Land Area As of 15 Jan 1999 21.7 21.5 14.5 a/ 13.8 17.0 11.5No. of Municipalities As of 30 June 2008 27 7 13 11 7 10No. of Barangays As of 30 June 2008 303 133 269 a/ 175 152 144DEMOGRAPHY (Source: NSO-CAR)Total Population As of 1 Aug 2007 230,953 103,633 372,533 d/ 180,711 182,326 148,661Percentage to the Region's Population As of 1 Aug 2008 15.2 6.8 24.5 d/ 11.9 12.0 9.8Population Density (persons/sq. km.) As of 1 Aug 2008 58 26 140 d/ 72 58 71Population Projection b/ 2008 237,600 117,600 699,800 193,500 210,000 167,100Male 2008 120,900 60,200 351,600 98,500 107,500 85,800Female 2008 116,700 57,400 348,200 95,000 102,500 81,300Ave. Annual Population Growth Rate b/ 2005-2010 1.26 1.85 2.72 a/ 2.03 1.80 1.66AGRICULTURE (Source: BAS-CAR)Inventory of Hogs (no. of heads) As of 1 Jul <strong>2011</strong> 55,920 24,314 12,795 35,869 42,387 33,219Inventory of Cattle (no. of heads) As of 1 Jul <strong>2011</strong> 19,918 2,250 7,912 10,618 7,330 8,940Inventory of Carabao (no. of heads) As of 1 Jul <strong>2011</strong> 40,704 11,162 9,200 7,919 11,994 6,097Inventory of Goat (no. of heads) As of 1 Jul <strong>2011</strong> 46,119 3,823 7,844 6,759 5,064 981Inventory of Chicken (no. of heads) As of 1 Jul <strong>2011</strong> 445,922 192,935 305,173 318,165 176,942 150,829Inventory of Ducks (no. of heads) As of 1 Jul <strong>2011</strong> 12,008 23,549 4,482 72,812 92,660 6,936Palay Production (metric tons) 2nd Quarter <strong>2011</strong> 12,762 37,625 2,354 9,838 65,782 1,986Corn Production (in metric tons) 4/ 2nd Quarter <strong>2011</strong> - 11,698 3 5,134 7,524 2,310Fish Production (metric tons) 2nd Quarter <strong>2011</strong> 206.3 55.1 95.0 345.9 143.2 6.5LABOR AND EMPLOYMENT (Source: NSO-CAR) **Total Population 15 years and over ('000) Apr 2003 142 61 230 106 109 91Male 71 31 125 55 55 47Female 72 30 106 51 54 44Labor Force Participation Rate Apr 2003 65.8 75.3 69.0 80.1 73.5 89.4Male 83.1 93.5 80.0 85.5 87.3 93.6Female 47.2 56.7 55.7 74.5 59.3 84.1Unemployment Rate Apr 2003 8.2 5.3 10.7 9.2 8.8 1.9Male 5.1 3.4 11.0 10.6 6.3 2.3Female 11.8 5.9 10.2 7.9 12.5 ***Visible Underemployment Rate Apr 2003 6.1 13.2 4.6 17.7 1.9 4.3INCOME AND PRICES (Source: NSO-CAR)Average Annual Family Income 2000 P111,185 P92,907 P139,918 d/ P82,245 P111,790 P98,369Average Annual Family Expenditure 2000 P89,183 P67,343 P117,354 d/ P66,284 P85,931 P74,292Annual Per Capita Poverty Threshold 2009 P16,132 P15,623 P15,820 P16,975 P14,781 P17,116Incidence of Poor Families 2009 33.3 36.3 4.0 21.3 19.3 33.8(proportion of poor families to the total no. of families)Consumer Price Index (2000=100) Sept <strong>2011</strong> 183.0 184.4 158.1 d/ 178.9 178.6 182.6Aug <strong>2011</strong> 181.8 185.2 157.7 d/ 178.5 178.3 182.1Jul <strong>2011</strong> 181.3 185.2 158.3 d/ 178.7 178.7 182.3Inflation Rate (2000=100) Sept <strong>2011</strong> 3.9 3.4 2.7 d/ 2.9 4.5 5.3Aug <strong>2011</strong> 3.4 4.5 2.3 d/ 2.4 4.2 4.8Jul <strong>2011</strong> 3.2 4.4 3.1 d/ 2.6 4.1 4.4* formerly a sub-province of Kalinga-Apayao (see Kalinga) **Benguet data do not include Baguio City p/ - preliminary *** - no. of unemployed is lessNote: Details may not add up to totals due to rounding. less than 500a/ includes Baguio Cityb/ 2000 Census-Based National, Regional and Provincial Population Projectionsc/ formerly a sub-province of Kalinga-Apayao (see Kalinga) 2/ estimate based on male proportion of 1995 population countd/ excludes Baguio City 3/ estimate based on female proportion of 1995 population counte/ based on the 2000 male-female proportion 4/ "-" indicates production volume of less than one metric tonSources of Data:BAS-CAR - Bureau of Agricultural Statistics - Cordillera Administrative Region NSO-CAR - National Statistics Office-Cordillera Administrative RegionDENR-CAR - Department of Environment and Natural Resources-Cordillera Administrative Region TWG-PGC - Technical Working Group On Philippine Geographic Classification, <strong>NSCB</strong><strong>NSCB</strong> - National Statistical Coordination Board
NATIONAL STATISTICAL COORDINATION BOARD 02 November <strong>2011</strong> SS-<strong>2011</strong>08-RCR-04Cordillera Administrative RegionPROVINCIALINDICATORS Reference Abra Apayao* Benguet Ifugao Kalinga Mt.PeriodProvinceTRANSPORTATION (Source: DOTC)Motor Vehicles Registered 2nd Quarter <strong>2011</strong> 5,087 767 4,985 1,256 1,358 653COMMUNICATION (Source: PPC)No. of Post Offices 2nd Quarter <strong>2011</strong> 28 7 17 d/ 8 8 10No. of Mail Carriers 2nd Quarter <strong>2011</strong> 27 5 22 d/ 9 7 13Mail Volume Delivered 2nd Quarter <strong>2011</strong> 66,149 3,733 78,490 25,663 25,130 38,795Revenue Generated 2nd Quarter <strong>2011</strong> 735,696 167,186 2,403,695 378,849 520,650 293,891HEALTH (Source: TWGMCM, <strong>NSCB</strong>)Estimated Infant Mortality Rate(per 1,000 livebirths) 1995 58.6 c/ 44.6 a/ 64.6 63.7 62.9Estimated Child Mortality Rate(per 1,000 children aged 1-4) 1995 26.0 c/ 15.6 a/ 30.4 29.7 29.0Estimated Under-Five Mortality Rate(per 1,000 livebirths) 1995 83.1 c/ 59.6 a/ 93.0 91.5 90.0Estimated Maternal Mortality Rate(per 100,000 livebirths) 1995 234.5 c/ 159.6 a/ 236.4 241.6 240.1LITERACY (Source: FLEMMS, DepEd/NSO)Simple Literacy Rate HouseholdPopulation 10 Years old & Over Nov 1994 92.2 c/ 96.6 d/ 70.6 83.0 83.3Male Nov 1994 92.9 c/ 98.0 d/ 71.0 83.0 86.8Female Nov 1994 91.3 c/ 95.0 d/ 70.1 83.1 78.9Functional Literacy Rate HouseholdPopulation 10 to 64 Years old Nov 1994 90.1 c/ 83.9 d/ 51.1 70.4 81.1Male Nov 1994 89.2 c/ 80.0 d/ 47.9 68.0 83.8Female Nov 1994 91.3 c/ 88.7 d/ 54.4 73.0 77.5EDUCATION (Source: DepEd-CAR)School Participation Rate (Public)Elementary 2009-2010 81.6 89.3 66.8 d/ 73.4 86.5 80.0Secondary 2009-2010 36.6 43.6 33.0 d/ 29.5 44.9 44.5No. of Enrolees (Public Elementary) 2009-2010 31,501 18,632 48,718 d/ 28,305 33,346 23,189No. of Enrolees (Public Secondary) 2009-2010 11,217 6,241 18,106 d/ 9,303 12,736 10,073Teacher to Pupil Ratio 1/ 2008-2009 1:22 1:30 1:26 d/ 1:27 1:29 1:23Teacher to Student Ratio 1/ 2008-2009 1:28 1:30 1:33 d/ 1:34 1:32 1:23PUBLIC ORDER AND SAFETY(Source: PRO-COR & BFP-CAR)Total Crime Volume 3rd Quarter <strong>2011</strong> 82 42 148 d/ 88 92 88Crime Solution Efficiency 3rd Quarter <strong>2011</strong> 31.7 19.0 34.5 d/ 57.9 46.7 23.9Fire Incidence 4th Quarter 2010 2 - 6 1 4 3Fire Damages to Property (in thousand pesos) 4th Quarter 2010 15.0 0.0 885.5 1,000.0 865.0 570.0INTERNAL REVENUE ALLOTMENT(Source: DBM-CAR) (in million pesos)Province Proper 2nd Quarter <strong>2011</strong> 135.1 119.1 135.7 111.2 120.0 100.7Municipalities 2nd Quarter <strong>2011</strong> 246.6 137.6 191.5 137.8 137.9 118.7City 2nd Quarter <strong>2011</strong> - - - - - -Barangay 2nd Quarter <strong>2011</strong> 64.9 28.4 53.9 41.8 37.6 34.1* formerly a sub-province of Kalinga-Apayao (see Kalinga) - (dash) - nil or zero … no data available1/ no. of teachers is based on the 1997 Personal Services Itemization (DepEd-CAR)a/ includes Baguio Cityc/ formerly a sub-province of Kalinga-Apayao (see Kalinga)d/ excludes Baguio CitySources of Data:BFP-CAR - Bureau of Fire Protection-Cordillera Administrative Region <strong>NSCB</strong> - National Statistical Coordination BoardDepEd-CAR - Department of Education-Cordillera Administrative RegionNSO-CAR - National Statistics Office-Cordillera Administrative RegionDOTC-CAR - Department of Transportation and Communication-Cordillera Administrative RegionPPC-CAR - Philippine Postal Corporation-Cordillera Administrative RegionFLEMMS - Functional Literacy, Education and Mass Media Survey, DepEd/NSO PRO-COR - Police Regional Office-Cordillera Administrative RegionTWGMCM - Technical Working Group on Maternal and Child MortalityFor your DATA needs, visit or call us at theNATIONAL STATISTICAL COORDINATION BOARDRegional Unit Cordillera Administrative Rion2/F JA Apartment39 Engineer's Hill, Baguio City 2600Telefax: (074) 444 9234 E-mail Address: nscbcar@yahoo.comURL: http://www.nscb.gov.ph/rucar


