MDG Watch - NSCB
MDG Watch - NSCB
MDG Watch - NSCB

You also want an ePaper? Increase the reach of your titles
YUMPU automatically turns print PDFs into web optimized ePapers that Google loves.
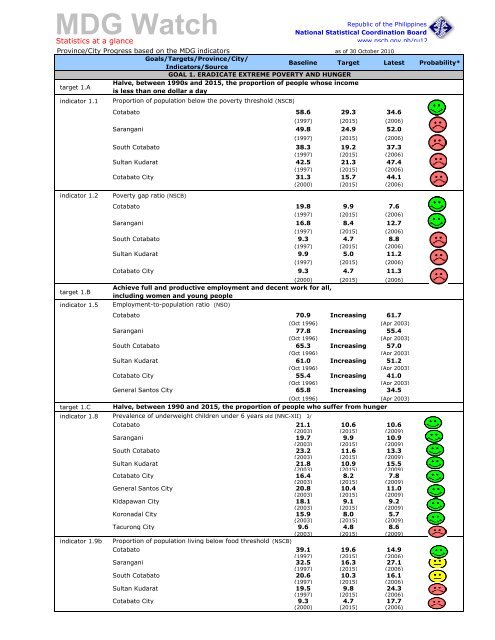
<strong>MDG</strong> <strong>Watch</strong>Republic of the PhilippinesNational Statistical Coordination BoardStatistics at a glancewww.nscb.gov.ph/ru12Province/City Progress based on the <strong>MDG</strong> indicators as of 30 October 2010Goals/Targets/Province/City/Indicators/SourceBaseline Target Latest Probability*GOAL 1. ERADICATE EXTREME POVERTY AND HUNGERtarget 1.Aindicator 1.1Halve, between 1990s and 2015, the proportion of people whose incomeis less than one dollar a dayProportion of population below the poverty threshold (<strong>NSCB</strong>)Cotabato 58.6 29.3 34.6indicator 1.2target 1.Bindicator 1.5target 1.Cindicator 1.8indicator 1.9b(1997) (2015) (2006)Sarangani 49.8 24.9 52.0(1997) (2015) (2006)South Cotabato 38.3 19.2 37.3(1997) (2015) (2006)Sultan Kudarat 42.5 21.3 47.4(1997) (2015) (2006)Cotabato City 31.3 15.7 44.1(2000) (2015) (2006)Poverty gap ratio (<strong>NSCB</strong>)Cotabato 19.8 9.9 7.6(1997) (2015) (2006)Sarangani 16.8 8.4 12.7(1997) (2015) (2006)South Cotabato 9.3 4.7 8.8(1997) (2015) (2006)Sultan Kudarat 9.9 5.0 11.2(1997) (2015) (2006)Cotabato City 9.3 4.7 11.3(2000) (2015) (2006)Achieve full and productive employment and decent work for all,including women and young peopleEmployment-to-population ratio (NSO)Cotabato 70.9 Increasing 61.7(Oct 1996) (Apr 2003)Sarangani 77.8 Increasing 55.4(Oct 1996) (Apr 2003)South Cotabato 65.3 Increasing 57.0(Oct 1996) (Apr 2003)Sultan Kudarat 61.0 Increasing 51.2(Oct 1996) (Apr 2003)Cotabato City 55.4 Increasing 41.0(Oct 1996) (Apr 2003)General Santos City 65.8 Increasing 34.5(Oct 1996) (Apr 2003)Halve, between 1990 and 2015, the proportion of people who suffer from hungerPrevalence of underweight children under 6 years old (NNC-XII) 3/Cotabato 21.1 10.6 10.6(2003) (2015) (2009)Sarangani 19.7 9.9 10.9(2003) (2015) (2009)South Cotabato 23.2 11.6 13.3(2003) (2015) (2009)Sultan Kudarat 21.8 10.9 15.5(2003) (2015) (2009)Cotabato City 16.4 8.2 7.8(2003) (2015) (2009)General Santos City 20.8 10.4 11.0(2003) (2015) (2009)Kidapawan City 18.1 9.1 9.2(2003) (2015) (2009)Koronadal City 15.9 8.0 5.7(2003) (2015) (2009)Tacurong City 9.6 4.8 8.6(2003) (2015) (2009)Proportion of population living below food threshold (<strong>NSCB</strong>)Cotabato 39.1 19.6 14.9(1997) (2015) (2006)Sarangani 32.5 16.3 27.1(1997) (2015) (2006)South Cotabato 20.6 10.3 16.1(1997) (2015) (2006)Sultan Kudarat 19.5 9.8 24.3(1997) (2015) (2006)Cotabato City 9.3 4.7 17.7(2000) (2015) (2006)
Province/City Progress based on the <strong>MDG</strong> indicators as of 30 October 2010Goals/Targets/Province/City/Indicators/SourceBaseline Target Latest Probability*GOAL 2. ACHIEVE UNIVERSAL PRIMARY EDUCATIONtarget 2.Aindicator 2.1Ensure that, by 2015, children everywhere, boys and girls alike, will be able to complete a full courseof primary schoolingNet enrolment ratio in primary education (DepEd-XII)Cotabato 90.3 100.0 82.4(2002) (2015) (2008)Sarangani 80.0 100.0 76.8(2002) (2015) (2008)South Cotabato 74.7 100.0 76.0(2002) (2015) (2008)Sultan Kudarat 76.0 100.0 71.4(2002) (2015) (2008)Cotabato City 106.3 100.0 107.1(2002) (2015) (2008)General Santos City 79.3 100.0 89.5(2002) (2015) (2008)Kidapawan City 78.9 100.0 76.8(2002) (2015) (2008)Koronadal City 75.4 100.0 80.1(2002) (2015) (2008)Tacurong City 76.9 100.0 72.5(2004) (2015) (2008)indicator 2.2 Proportion of pupils starting grade 1 who reach grade 6 (DepEd-XII)Cotabato 66.2 100.0 65.1(2002) (2015) (2008)Sarangani 56.1 100.0 61.1(2002) (2015) (2008)South Cotabato 62.4 100.0 70.4(2002) (2015) (2008)Sultan Kudarat 59.3 100.0 62.1(2002) (2015) (2008)Cotabato City 65.9 100.0 70.5(2002) (2015) (2008)General Santos City 75.4 100.0 76.0(2002) (2015) (2008)Kidapawan City 71.1 100.0 76.6(2002) (2015) (2008)Koronadal City 63.3 100.0 83.5(2002) (2015) (2008)Tacurong City 66.7 100.0 81.5(2004) (2015) (2008)indicator 2.2a Primary completion rate (DepEd-XII)Cotabato 62.9 100.0 63.8(2002) (2015) (2008)Sarangani 52.8 100.0 58.9(2002) (2015) (2008)South Cotabato 62.4 100.0 68.6(2002) (2015) (2008)Sultan Kudarat 57.6 100.0 58.0(2002) (2015) (2008)Cotabato City 64.4 100.0 68.6(2002) (2015) (2008)General Santos City 75.4 100.0 76.6(2002) (2015) (2008)Kidapawan City 67.4 100.0 74.8(2002) (2015) (2008)Koronadal City 63.2 100.0 82.2(2002) (2015) (2008)Tacurong City 63.0 100.0 80.3(2004) (2015) (2008)GOAL 3. PROMOTE GENDER EQUALITY AND EMPOWER WOMENtarget 3.AEliminate gender disparity in primary and secondary education preferably by 2005 and to all levels ofeducation no later than 2015indicator 3.1aRatio of girls to boys in primary education (DepEd-XII) 2/Cotabato 0.96 1.00 0.96(2003) (2015) (2009)Sarangani 0.98 1.00 0.96(2003) (2015) (2009)South Cotabato 0.95 1.00 0.95(2003) (2015) (2009)Sultan Kudarat 0.95 1.00 0.95(2003) (2015) (2009)Cotabato City 1.03 1.00 1.03 Target Attained(2003) (2015) (2009)General Santos City 0.97 1.00 0.95(2003) (2015) (2009)
Province/City Progress based on the <strong>MDG</strong> indicators as of 30 October 2010Goals/Targets/Province/City/Indicators/SourceBaseline Target Latest Probability*target 3.AEliminate gender disparity in primary and secondary education preferably by 2005 and to all levels ofeducation no later than 2015Kidapawan City 0.95 1.00 0.92(2003) (2015) (2009)Koronadal City 0.95 1.00 0.91(2003) (2015) (2009)Tacurong City 1.01 1.00 0.92(2004) (2015) (2009)indicator 3.1b Ratio of girls to boys in secondary education (DepEd-XII) 2/indicator 3.1dtarget 5.Aindicator 4.1indicator 4.2Cotabato 1.08 1.00 1.05 Target Attained(2003) (2015) (2009)Sarangani 1.17 1.00 1.16 Target Attained(2003) (2015) (2009)South Cotabato 1.06 1.00 1.01 Target Attained(2003) (2015) (2009)Sultan Kudarat 1.08 1.00 1.05 Target Attained(2003) (2015) (2009)Cotabato City 1.23 1.00 1.08 Target Attained(2003) (2015) (2009)General Santos City 1.08 1.00 1.05 Target Attained(2003) (2015) (2009)Kidapawan City 1.12 1.00 1.05 Target Attained(2003) (2015) (2008)Koronadal City 1.13 1.00 1.05 Target Attained(2003) (2015) (2009)Tacurong City 1.08 1.00 1.01 Target Attained(2004) (2015) (2009)Ratio of literate females to males of 15-24 year-olds (1990 & 2000 CPH, NSO)Cotabato 96.6 100.0 97.1(1990) (2015) (2000)Sarangani 96.3 100.0 96.9(1990) (2015) (2000)South Cotabato 96.4 100.0 96.0(1990) (2015) (2000)Sultan Kudarat 94.6 100.0 97.0(1990) (2015) (2000)Cotabato City 120.0 100.0 121.4(1990) (2015) (2000)General Santos City 108.1 100.0 107.7(1990) (2015) (2000)Kidapawan City 102.8 100.0 102.1(1990) (2015) (2000)Koronadal City 101.7 100.0 103.9(1990) (2015) (2000)Tacurong City 102.0 100.0 101.2(1990) (2015) (2000)GOAL 4. REDUCE CHILD MORTALITYReduce by two-thirds, between 1990 and 2015, the under-five mortality rateUnder-five mortality rate per 1,000 livebirths (TWG on Maternal and Child Mortality, <strong>NSCB</strong> & NSO) 6/Cotabato 73.4 24.5 7.8(1990) (2015) (2003)South Cotabato 7/ 77.4 25.8 16.7(1990) (2015) (2003)Sultan Kudarat 82.4 27.5 18.9(1990) (2015) (2003)Cotabato City 60.9 20.3 6.9(1990) (2015) (2003)General Santos City 57.2 19.1 24.7(1990) (2015) (2003)Infant mortality rate per 1,000 livebirths (TWG on Maternal and Child Mortality, <strong>NSCB</strong> & NSO)Cotabato 53.0 17.7 24.7(1990) (2015) (2003)South Cotabato 7/ 55.4 18.5 10.1(1990) (2015) (2003)Sultan Kudarat 58.5 19.5 9.8(1990) (2015) (2003)Cotabato City 44.0 14.7 4.8(1990) (2015) (2003)General Santos City 43.2 14.4 15.8(1990) (2015) (2003)
Province/City Progress based on the <strong>MDG</strong> indicators as of 30 October 2010Goals/Targets/Province/City/Indicators/SourceBaseline Target Latest Probability*indicator 4.3 Proportion of children under 1 year old imunized against measles (DOH-XII) 4/Cotabato 72.7 100.0 98.6(2003) (2015) (2009)Sarangani 80.9 100.0 89.2(2003) (2015) (2009)South Cotabato 72.4 100.0 92.1(2003) (2015) (2009)Sultan Kudarat 83.2 100.0 88.5(2003) (2015) (2009)Cotabato City 73.8 100.0 75.2(2003) (2015) (2009)General Santos City 88.1 100.0 81.3(2003) (2015) (2009)GOAL 5. REDUCE MATERNAL MORTALITYtarget 5.Aindicator 5.1indicator 5.2target 5.Bindicator 5.3indicator 5.5atarget 6.Cindicator 6.6aReduce by three-quarters, between 1990 and 2015, the maternal mortality ratioMaternal mortality ratio per 100,000 livebirths (TWG on Maternal and Child Mortality, <strong>NSCB</strong> & NSO) 6/Cotabato 167.5 41.9 113.7(1990) (2015) (2003)South Cotabato 7/ 214.1 53.5 135.9(1990) (2015) (2003)Sultan Kudarat 269.7 67.4 182.1(1990) (2015) (2003)Cotabato City 182.8 45.7 68.6(1990) (2015) (2003)General Santos City 210.0 52.5 81.6(1990) (2015) (2003)Proportion of births attended by skilled health personnel (DOH-XII) 4/Cotabato 41.6 100.0 62.7(2003) (2015) (2009)Sarangani 32.7 100.0 52.9(2003) (2015) (2009)South Cotabato 50.9 100.0 74.7(2003) (2015) (2009)Sultan Kudarat 48.1 100.0 67.9(2003) (2015) (2009)Cotabato City 56.4 100.0 59.4(2003) (2015) (2008)General Santos City 53.1 100.0 62.3(2003) (2015) (2009)Achieve, by 2015, universal access to reproductive healthContraceptive prevalence rate (DOH-XII) 4/Cotabato 37.5 100.0 61.8(2004) (2015) (2009)Sarangani 50.0 100.0 37.7(2004) (2015) (2009)South Cotabato 50.1 100.0 62.8(2004) (2015) 50.56Sultan Kudarat 47.7 100.0 55.8(2004) (2015) (2009)Cotabato City 23.6 100.0 45.3(2004) (2015) (2009)General Santos City 48.1 100.0 61.6(2004) (2015) (2009)Percentage of pregnant women with 4 or more prenatal visits (DOH-XII) 4/Cotabato 54.7 100.0 66.3(2003) (2015) (2009)Sarangani 46.2 100.0 52.1(2003) (2015) (2009)South Cotabato 20.5 100.0 57.1(2003) (2015) (2009)Sultan Kudarat 56.8 100.0 55.3(2003) (2015) (2009)Cotabato City 12.8 100.0 20.4(2003) (2015) (2009)General Santos City 60.9 100.0 45.1(2003) (2015) (2009)GOAL 6. COMBAT HIV/AIDS, MALARIA AND OTHER DISEASESHave halted by 2015 and begun to reverse the incidence of malaria and major diseasesPrevalence of malaria per 100,000 population (DOH-XII) 4/Cotabato 7.4 0.0 18.9(2003) (2015) (2009)Sarangani 25.9 0.0 70.3(2003) (2015) (2009)South Cotabato 1.3 0.0 1.2(2003) (2015) (2009)Sultan Kudarat 217.7 0.0 127.9(2003) (2015) (2009)Cotabato CityNot EndemicGeneral Santos City 0.4 0.0 7.2(2003) (2015) (2009)
Province/City Progress based on the <strong>MDG</strong> indicators as of 30 October 2010Goals/Targets/Province/City/Baseline Target Latest Probability*Indicators/Sourceindicator 6.6b Death rate associated with malaria per 100,000 pop'n (DOH-XII) 4/Cotabato 0.1 0.0 0.1(2003) (2015) (2009)Sarangani 0.6 0.0 0.0(2003) (2015) (2009)South Cotabato 0.1 0.0 0.0(2003) (2015) (2008)Sultan Kudarat 1.1 0.0 0.3(2003) (2015) (2009)Cotabato CityNot EndemicGeneral Santos City 0.4 0.0 0.0(2003) (2015) (2009)indicator 6.8aindicator 6.8btarget 7.Cindicator 7.8aindicator 7.9aPrevalence of tuberculosis per 100,000 population (DOH-XII) 4/Cotabato 151.8 0.0 131.0(2004) (2015) (2009)Sarangani 139.2 0.0 77.0(2004) (2015) (2009)South Cotabato 201.2 0.0 125.0(2004) (2015) (2009)Sultan Kudarat 95.2 0.0 22.8(2004) (2015) (2009)Cotabato City 82.8 0.0 53.0(2004) (2015) (2009)General Santos City 210.0 0.0 144.0(2004) (2015) (2009)Kidapawan City 182.2 0.0 281.2(2004) (2015) (2009)Death rate associated with tuberculosis per 100,000 pop'n (DOH-XII) 4/Cotabato 13.4 0.0 12.4(2004) (2015) (2009)Sarangani 10.1 0.0 11.7(2004) (2015) (2009)South Cotabato 18.5 0.0 11.5(2004) (2015) (2009)Sultan Kudarat 12.8 0.0 7.9(2004) (2015) (2009)Cotabato City 19.2 0.0 10.6(2004) (2015) (2009)General Santos City 22.8 0.0 25.7(2004) (2015) (2009)Kidapawan City 32.5 0.0 19.6(2004) (2015) (2009)GOAL 7. ENSURE ENVIRONMENTAL SUSTAINABILITYHalve, by 2015, the proportion of population without sustainable access to safe drinking water andimproved sanitationProportion of households with access to safe drinking water (1990 & 2000 CPH, and 2007 SR-MICS, NSO)Cotabato 52.3 76.2 73.9(1990) (2015) (2007)Sarangani 50.1 75.1 81.6(1990) (2015) (2007)South Cotabato 71.3 85.7 76.0(1990) (2015) (2000)Sultan Kudarat 68.4 84.2 79.9(1990) (2015) (2007)Cotabato City 86.0 93.0 72.1(1990) (2015) (2000)General Santos City 96.3 98.2 91.6(1990) (2015) (2000)Kidapawan City 61.5 80.8 68.2(1990) (2015) (2000)Koronadal City 92.5 96.2 93.2(1990) (2015) (2000)Tacurong City 94.7 97.3 97.7(1990) (2015) (2000)Proportion of households with sanitary toilet facility (1990 & 2000 CPH, and 2007 SR-MICS, NSO)Cotabato 34.6 67.3 81.8(1990) (2015) (2007)Sarangani 36.0 68.0 72.2(1990) (2015) (2007)South Cotabato 56.3 78.2 68.2(1990) (2015) (2000)Sultan Kudarat 47.7 73.9 77.9(1990) (2015) (2007)Cotabato City 52.4 76.2 76.1(1990) (2015) (2000)
Province/City Progress based on the <strong>MDG</strong> indicators as of 30 October 2010Goals/Targets/Province/City/Indicators/SourceBaseline Target Latest Probability*indicator 7.9a Proportion of households with sanitary toilet facility (1990 & 2000 CPH, and 2007 SR-MICS, NSO)General Santos City 71.3 85.7 87.9(1990) (2015) (2000)Kidapawan City 51.8 75.9 69.3(1990) (2015) (2000)Koronadal City 82.0 91.0 88.1(1990) (2015) (2000)Tacurong City 81.7 90.8 91.2(1990) (2015) (2000)Target 7.D By 2020, have achieved significant improvement in the lives of at least 100 million slum dwellersindicator 7.9a Proportion of households with access to secure tenure (1990 & 2000 CPH, NSO)Cotabato 88.7 Increasing 62.7(1990) (2000)Sarangani 92.8 Increasing 53.3(1990) (2000)South Cotabato 91.6 Increasing 64.4(1990) (2000)Sultan Kudarat 92.8 Increasing 60.0(1990) (2000)Cotabato City 90.7 Increasing 56.0(1990) (2000)General Santos City 89.9 Increasing 62.5(1990) (2000)GOAL 8. DEVELOP A GLOBAL PARTNERSHIP FOR DEVELOPMENTtarget 8.A1indicator 8.2aPursue partnership/collaboration between LGUs and NGOs/private organizations in support togovernance, development and poverty reduction both nationally and internationallyProportion of IRA to total LGU income (BLGF and City/Provincial Treasurers Offices)Cotabato 82.3 Decreasing 79.6(2001) (2008)Sarangani 84.7 Decreasing 91.6(2001) (2008)South Cotabato 83.0 Decreasing 81.8(2001) (2008)Sultan Kudarat 89.0 Decreasing 92.9(2001) (2008)Cotabato City 76.9 Decreasing 80.2(2001) (2008)General Santos City 60.5 Decreasing 67.3(2001) (2008)Kidapawan City 70.6 Decreasing 65.0(2001) (2008)Koronadal City 73.8 Decreasing 79.4(2001) (2008)Tacurong City 70.8 Decreasing 78.3(2001) (2008)indicator 8.2b Proportion of LGU expenditures for social services (BLGF and City/Provincial Treasurers Offices) 5/Cotabato 14.5 Increasing 14.5(2001) (2008)Sarangani 14.1 Increasing 18.9(2001) (2008)South Cotabato 20.3 Increasing 23.9(2001) (2008)Sultan Kudarat 16.3 Increasing 12.9(2001) (2008)Cotabato City 15.1 Increasing 8.0(2001) (2008)General Santos City 30.8 Increasing 26.4(2001) (2008)Kidapawan City 13.9 Increasing 11.2(2001) (2008)Koronadal City 23.8 Increasing 10.6(2001) (2008)Tacurong City 14.2 Increasing 7.6(2001) (2008)Target 8.Eindicator 8.13aIn cooperation with pharmaceutical companies, provide access to affordable, essential drugs indeveloping countriesProportion of barangays with "Botica sa Barangay" (DOH-XII)Cotabato 3.5 Increasing 20.3(2004) (2009)Sarangani 0.7 Increasing 30.7(2004) (2009)South Cotabato 11.6 Increasing 61.3(2004) (2009)Sultan Kudarat 5.7 Increasing 42.1(2004) (2009)Cotabato City 0.0 Increasing 10.8(2004) (2009)General Santos City 3.9 Increasing 30.8(2004) (2009)
Province/City Progress based on the <strong>MDG</strong> indicators as of 30 October 2010Goals/Targets/Province/City/Indicators/SourceBaseline Target Latest Probability*Target 8.Findicator 8.17aIn cooperation with the private sector, make available the benefits of new technologies, especiallyinformation and communicationsProportion of energized barangays (Electric Utilities)Cotabato 51.0 Increasing 100.0(1998) (2009)Sarangani 70.7 Increasing 100.0(1998) (2009)South Cotabato 70.5 Increasing 100.0(1998) (2009)Sultan Kudarat 47.1 Increasing 76.4(1998) (2009)Cotabato City 100.0 Increasing 100.0(1998) (2009)General Santos City 88.5 Increasing 100.0(1998) (2009)Tacurong City 100.0 Increasing 100.0(1998) (2009)Kidapawan City 75.0 Increasing 100.0(1998) (2009)Koronadal City 100.0 Increasing 100.0(1998) (2009)a/ Regional figures average of Cotabato, Sultan Kudarat, South Cotabato, Cotabato City and General Santos City.1/ Regional figures based on the old regional set-up which excludes South Cotabato, Sarangani and General Santos City2/ Figures for public schools only; sourced from the BEIS3/ Data starting 2003 based on the International reference Standard (IRS); figures for previous years based on the National reference Standard (NRS)4/ With the issuance of EO 36, DOH-started gathering data for South Cotabato, Sarangani , General Santos City, Koronadal City and Tacurong City only in 2003.5/ expenditures on health, nutrition and population control, labor and employment, housing and community devlopment, and social services and welfare6/ 2004 data were based on actual registration; without any adjustments for under registration;7/ includes Sarangani, no separate data for Sarangani* based on the comparison of actual (from baseline to latest data) and required (from baseline to target year) rates of progressProbability of Achieving the Goal:Low: Pace of Progress is less than 0.5Medium: Pace of Progress between 0.5 and 0.9High: Pace of Progress is greater than 0.9For your inquiries and information needs, visit or call the:National Statistical Coordination Board-XII, cor. Gonzalo Javier and Ugalingan Piang Sts., Cotabato CityTelefax No. (064) 421-1817, e-mail address: nscbrd12@yahoo.com, website: www.nscb.gov.ph/ru12