2009 City/Municipal Poverty Incidence of the Philippines ... - NSCB
2009 City/Municipal Poverty Incidence of the Philippines ... - NSCB
2009 City/Municipal Poverty Incidence of the Philippines ... - NSCB

You also want an ePaper? Increase the reach of your titles
YUMPU automatically turns print PDFs into web optimized ePapers that Google loves.
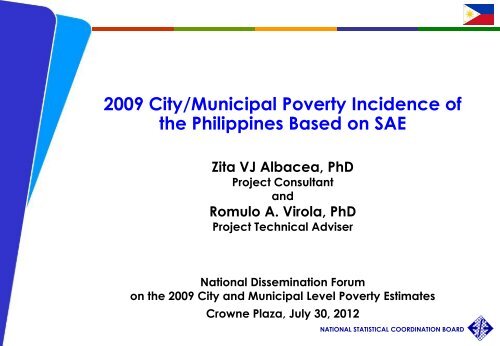
<strong>2009</strong> <strong>City</strong>/<strong>Municipal</strong> <strong>Poverty</strong> <strong>Incidence</strong> <strong>of</strong><strong>the</strong> <strong>Philippines</strong> Based on SAEZita VJ Albacea, PhDProject ConsultantandRomulo A. Virola, PhDProject Technical Adviser1National Dissemination Forumon <strong>the</strong> <strong>2009</strong> <strong>City</strong> and <strong>Municipal</strong> Level <strong>Poverty</strong> EstimatesDissemination Forum <strong>of</strong> <strong>the</strong> <strong>2009</strong> SAE <strong>of</strong> <strong>Poverty</strong> StatisticsZVJAlbacea and RAVirola/30 July 2012Crowne Plaza, July 30, 2012NATIONAL STATISTICAL COORDINATION BOARD
Outline <strong>of</strong> <strong>the</strong> PresentationI. Background/Rationale <strong>of</strong> <strong>the</strong> StudyII. Small Area Estimation MethodologyIII. Resulting Regional Models Used forPredictionIV. <strong>2009</strong> Intercensal SAE <strong>of</strong> <strong>Poverty</strong><strong>Incidence</strong> for Cities and <strong>Municipal</strong>itiesin <strong>the</strong> <strong>Philippines</strong>V. Lessons Learned2Dissemination Forum <strong>of</strong> <strong>the</strong> <strong>2009</strong> SAE <strong>of</strong> <strong>Poverty</strong> StatisticsZVJAlbacea and RAVirola/30 July 2012NATIONAL STATISTICAL COORDINATION BOARD
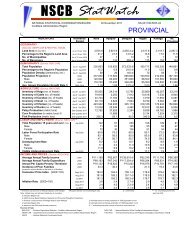
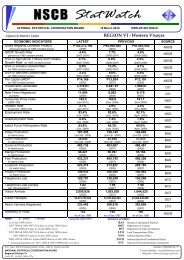
I. Background/Rationale <strong>of</strong> <strong>the</strong> Study• Philippine <strong>Poverty</strong> Statistics are released by <strong>the</strong> NationalStatistical Coordination Board (<strong>NSCB</strong>) every three years at<strong>the</strong> regional and provincial levels <strong>of</strong> disaggregation. Latestestimates are for <strong>2009</strong>.• For <strong>2009</strong>, poverty estimates for all 17 regions, which wereobtained directly from <strong>the</strong> results <strong>of</strong> <strong>the</strong> Family Income andExpenditure Survey (FIES), are reliable (having coefficients<strong>of</strong> variation (CVs) <strong>of</strong> at most 10%).• In <strong>the</strong> case <strong>of</strong> <strong>the</strong> <strong>2009</strong> provincial poverty statistics,estimates <strong>of</strong> 64 <strong>of</strong> <strong>the</strong> 80 provinces (80%), which were alsodirectly obtained using <strong>the</strong> FIES data set, are less reliable(having CVs greater than10%).- One <strong>of</strong> <strong>the</strong> reasons for less reliable estimates include<strong>the</strong> small number <strong>of</strong> observations in some provinces.3Dissemination Forum <strong>of</strong> <strong>the</strong> <strong>2009</strong> SAE <strong>of</strong> <strong>Poverty</strong> StatisticsZVJAlbacea and RAVirola/30 July 2012NATIONAL STATISTICAL COORDINATION BOARD
<strong>2009</strong> Official Regional<strong>Poverty</strong> <strong>Incidence</strong><strong>2009</strong> Official Provincial<strong>Poverty</strong> <strong>Incidence</strong>4Dissemination Forum <strong>of</strong> <strong>the</strong> <strong>2009</strong> SAE <strong>of</strong> <strong>Poverty</strong> StatisticsZVJAlbacea and RAVirola/30 July 2012NATIONAL STATISTICAL COORDINATION BOARD
I. Background/Rationale <strong>of</strong> <strong>the</strong> Study• As not all cities/municipalities are represented in<strong>the</strong> FIES and due to concerns on <strong>the</strong> reliability <strong>of</strong>estimates, no <strong>of</strong>ficial city or municipal levelestimates are generated directly from <strong>the</strong> FIES.• In 2005, <strong>the</strong> <strong>NSCB</strong> with funding assistance from <strong>the</strong>World Bank ASEM Trust Fund, conducted a povertymapping project using small area estimationmethodology as part <strong>of</strong> <strong>the</strong> Philippine StatisticalSystem’s continuing effort to respond to <strong>the</strong> growingneed for lower level disaggregation <strong>of</strong> informationon <strong>the</strong> poor.• As an output <strong>of</strong> this Project, poverty estimates for allcities and municipalities <strong>of</strong> <strong>the</strong> country for 2000were released in November 2005.5Dissemination Forum <strong>of</strong> <strong>the</strong> <strong>2009</strong> SAE <strong>of</strong> <strong>Poverty</strong> StatisticsZVJAlbacea and RAVirola/30 July 2012NATIONAL STATISTICAL COORDINATION BOARD
II. Small Area Estimation Methodology• The Elbers, Lanjouw and Lanjouw (ELL) Methodologywas used in 2005 to generate <strong>the</strong> 2000 <strong>City</strong> and<strong>Municipal</strong> level <strong>Poverty</strong> Statistics2000 Family Income andExpenditure Survey2000 Labor Force Survey2000 Census <strong>of</strong> Populationand Housing2000 <strong>City</strong> and<strong>Municipal</strong> Level<strong>Poverty</strong> Statisticsbased on SAE• poverty estimates for all cities and municipalities <strong>of</strong> <strong>the</strong>country for 2000 were released in November 2005 by <strong>the</strong><strong>NSCB</strong>.6Dissemination Forum <strong>of</strong> <strong>the</strong> <strong>2009</strong> SAE <strong>of</strong> <strong>Poverty</strong> StatisticsZVJAlbacea and RAVirola/30 July 2012NATIONAL STATISTICAL COORDINATION BOARD
II. Small Area Estimation Methodology• <strong>NSCB</strong> embarked on <strong>the</strong> Intercensal Updating <strong>of</strong> SAEProject in 2006 through <strong>the</strong> World Bank Trust Fund forStatistical Capacity Building (WB TFSCB)2000 SAE 2003 SAE2000 FamilyIncome andExpenditureSurvey2000 LaborForce Survey2000 Census <strong>of</strong>Population andHousing2003 FamilyIncome andExpenditureSurvey2003 Labor ForceSurvey2000 Census <strong>of</strong>Population andHousingTimeinvariant(i.e.,variablesthat maybeconsidered“stable”over time)7Dissemination Forum <strong>of</strong> <strong>the</strong> <strong>2009</strong> SAE <strong>of</strong> <strong>Poverty</strong> StatisticsZVJAlbacea and RAVirola/30 July 2012NATIONAL STATISTICAL COORDINATION BOARD
III. Resulting Regional Models Used for PredictionAdjusted R 2(in percent)Number <strong>of</strong>PredictorsNumber <strong>of</strong>ObservationsNCR CAR R1 R2 R3 R4A R4B R5 R6 R735 47 35 45 38 40 44 43 44 469 9 5 8 9 7 5 7 9 74,276 1,566 2,265 1,890 3,027 3,647 1,661 2,191 2,560 2,513Adjusted R 2(in percent)Number <strong>of</strong>PredictorsNumber <strong>of</strong>ObservationsR8 R9 R10 R11 R12 ARMM CARAGA45 49 48 46 47 29 417 6 8 8 5 8 81,985 1,642 1,756 2,131 1,923 1,567 1,5618Dissemination Forum <strong>of</strong> <strong>the</strong> <strong>2009</strong> SAE <strong>of</strong> <strong>Poverty</strong> StatisticsZVJAlbacea and RAVirola/30 July 2012NATIONAL STATISTICAL COORDINATION BOARD
III. Resulting Regional Models Used for PredictionHousehold CharacteristicsProportion <strong>of</strong> all/male /female household members who have at leastcollege educationProportion <strong>of</strong> male /female household members who are at least highschool graduatesNo <strong>of</strong> Models10 / 2 / 4Proportion <strong>of</strong> male household members who are at least finished grade 5 13 / 2Presence or absence <strong>of</strong> a son/daughter <strong>of</strong> <strong>the</strong> household head in <strong>the</strong>householdThe household has• extended family members living with <strong>the</strong>m• household head who is married• household head without a spouseThe housing unit where <strong>the</strong> household resides has• ro<strong>of</strong> made <strong>of</strong> strong materials (brick, stone, wood, galvanized iron)• wall made <strong>of</strong> light materials (bamboo, sawali, cogon, nipa)• ro<strong>of</strong> made <strong>of</strong> light materials (cogon, nipa, anahaw)• wall made <strong>of</strong> makeshift materials• ro<strong>of</strong> made <strong>of</strong> salvaged materials7131543119Dissemination Forum <strong>of</strong> <strong>the</strong> <strong>2009</strong> SAE <strong>of</strong> <strong>Poverty</strong> StatisticsZVJAlbacea and RAVirola/30 July 2012NATIONAL STATISTICAL COORDINATION BOARD
III. Resulting Regional Models Used for Prediction10Barangay CharacteristicsThe barangay where <strong>the</strong> household resides• has at least 50% <strong>of</strong> its at least 10 yrs old population are farmers, farmlaborers, fishermen, loggers and forest product ga<strong>the</strong>rers;• has seaport• is part <strong>of</strong> <strong>the</strong> town/city proper <strong>of</strong> former poblacion <strong>of</strong> <strong>the</strong> municipality, orpoblacion/city district• has telephone system• has cellular phone signal• has public plaza• is accessible to national highway• is urban• has a market place or building where trading activities are carried on at leastonce a week• has a puericulture center/barangay health centerAverage number <strong>of</strong> financial establishments with less than 10 employees in <strong>the</strong>barangayAverage number <strong>of</strong> manufacturing establishments with less than 10 employeesin <strong>the</strong> barangayAverage number <strong>of</strong> commercial establishments with less than 10 employees in<strong>the</strong> barangayAverage number <strong>of</strong> lodging establishments with less than 10 employees in <strong>the</strong>barangayAverage number <strong>of</strong> service establishments with less than 10 employees in <strong>the</strong>Dissemination Forum <strong>of</strong> <strong>the</strong> <strong>2009</strong> SAE <strong>of</strong> <strong>Poverty</strong> StatisticsZVJAlbaceabarangayand RAVirola/30 July 2012No. <strong>of</strong> ModelsNATIONAL STATISTICAL COORDINATION BOARD911111111112111
III. Resulting Regional Models Used for PredictionBarangay CharacteristicsAverage proportion <strong>of</strong> household members residing in <strong>the</strong> barangay whoare between 15 to 24 years oldAverage proportion <strong>of</strong> household members residing in <strong>the</strong> barangay whoare between 25 to 60 years oldAverage proportion <strong>of</strong> household members residing in <strong>the</strong> barangay whoare children <strong>of</strong> <strong>the</strong> household headAverage number <strong>of</strong> household members residing in <strong>the</strong> barangay who areworking as pr<strong>of</strong>essionalsAverage number <strong>of</strong> household members residing in <strong>the</strong> barangay who areworking in trade and trade-related workersAverage number <strong>of</strong> household members residing in <strong>the</strong> barangay who areworking as plant and machine operators and assemblersAverage number <strong>of</strong> household members residing in <strong>the</strong> barangay who areworking as <strong>of</strong>ficials <strong>of</strong> government, and special interst organizations,corporate executives, managers, managing proprietors and supervisorsAverage number <strong>of</strong> household members residing in <strong>the</strong> barangay who areworking as clerksAverage number <strong>of</strong> household members residing in <strong>the</strong> barangay who arefarmers, farm laborers, fishermen, loggers and forest product ga<strong>the</strong>rers;No. <strong>of</strong> Models2224311110Average family size in <strong>the</strong> barangay 1011Dissemination Forum <strong>of</strong> <strong>the</strong> <strong>2009</strong> SAE <strong>of</strong> <strong>Poverty</strong> StatisticsZVJAlbacea and RAVirola/30 July 2012NATIONAL STATISTICAL COORDINATION BOARD
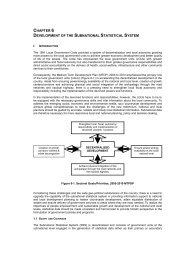
IV. <strong>2009</strong> Intercensal SAE <strong>of</strong> <strong>Poverty</strong> <strong>Incidence</strong>Distribution <strong>of</strong> poverty incidences among population for <strong>the</strong>1,643 cities and municipalities<strong>Poverty</strong>incidenceamongpopulationSAEFrequency Percent < RCFBinondo,ManilaSiayan,Zamboanga delNorte< =25 578 35 1225-50 816 50 850 20 40 60 80<strong>Poverty</strong> <strong>Incidence</strong>> 50 249 15 100MEAN STD DEV MINIMUM MAXIMUM32.57 16.281.03(Binondo, Manila)79.86(Siayan, Zamboanga del Norte)12Dissemination Forum <strong>of</strong> <strong>the</strong> <strong>2009</strong> SAE <strong>of</strong> <strong>Poverty</strong> StatisticsZVJAlbacea and RAVirola/30 July 2012NATIONAL STATISTICAL COORDINATION BOARD
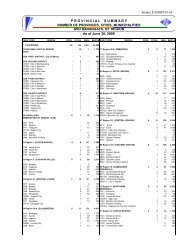
IV. <strong>2009</strong> Intercensal SAE <strong>of</strong> <strong>Poverty</strong> <strong>Incidence</strong>Distribution <strong>of</strong> <strong>the</strong> coefficients <strong>of</strong> variation <strong>of</strong> <strong>the</strong> povertyincidences among population for <strong>the</strong> 1,643 cities andmunicipalitiesCoefficient <strong>of</strong> VariationEsperanza, Agusan del SurFreqPercent < RCFErmita, Manila< =10 619 38 3811-20 822 50 88> 20 202 12 1000 20 40 60 80Coefficient <strong>of</strong> VariationMEAN STD DEV MINIMUM MAXIMUM13.60 7.814.41(Esperanza, Agusan del Sur)68.71(Ermita, Manila)13Dissemination Forum <strong>of</strong> <strong>the</strong> <strong>2009</strong> SAE <strong>of</strong> <strong>Poverty</strong> StatisticsZVJAlbacea and RAVirola/30 July 2012NATIONAL STATISTICAL COORDINATION BOARD
IV. <strong>2009</strong> Intercensal SAE <strong>of</strong> <strong>Poverty</strong> <strong>Incidence</strong>14Dissemination Forum <strong>of</strong> <strong>the</strong> <strong>2009</strong> SAE <strong>of</strong> <strong>Poverty</strong> StatisticsZVJAlbacea and RAVirola/30 July 2012NATIONAL STATISTICAL COORDINATION BOARD
IV. <strong>2009</strong> Intercensal SAE <strong>of</strong> <strong>Poverty</strong> <strong>Incidence</strong>2003<strong>2009</strong><strong>City</strong>/<strong>Municipal</strong>-level <strong>Poverty</strong> Estimates (Based on SAE)15Dissemination Forum <strong>of</strong> <strong>the</strong> <strong>2009</strong> SAE <strong>of</strong> <strong>Poverty</strong> StatisticsZVJAlbacea and RAVirola/30 July 2012NATIONAL STATISTICAL COORDINATION BOARD
IV. <strong>2009</strong> Intercensal SAE <strong>of</strong> <strong>Poverty</strong> <strong>Incidence</strong>2003<strong>2009</strong>NORTHERN SAMARSAMAR (WESTERN)BILIRANEASTERN SAMARLEYTE1.5 - 18SOUTHERN LEYTE<strong>City</strong>/<strong>Municipal</strong>-level <strong>Poverty</strong> Estimates(Based on SAE) <strong>of</strong> Eastern Visayas16Dissemination Forum <strong>of</strong> <strong>the</strong> <strong>2009</strong> SAE <strong>of</strong> <strong>Poverty</strong> StatisticsZVJAlbacea and RAVirola/30 July 2012NATIONAL STATISTICAL COORDINATION BOARD
IV. <strong>2009</strong> Intercensal SAE <strong>of</strong> <strong>Poverty</strong> <strong>Incidence</strong><strong>2009</strong> Poorest <strong>Municipal</strong>ities Based on SAERank Region Province <strong>Municipal</strong>ity<strong>Poverty</strong><strong>Incidence</strong>StandardErrorCoefficient <strong>of</strong>Variation1 IX ZAMBOANGA DEL NORTE SIAYAN 79.86 4.53 5.672 CAR ABRA BUCLOC 77.18 10.05 13.023 IX ZAMBOANGA DEL NORTE BALIGUIAN 75.31 4.86 6.454 XI DAVAO DEL SUR JOSE ABAD SANTOS 72.32 4.06 5.615 XI DAVAO DEL SUR SARANGANI 72.12 4.95 6.866 IX ZAMBOANGA DEL NORTE GODOD 71.06 6.84 9.627 IX ZAMBOANGA DEL NORTE GUTALAC 70.41 4.63 6.578 ARMM MAGUINDANAO PANDAG 70.10 8.60 12.279 X LANAO DEL NORTE TAGOLOAN 69.38 5.76 8.3010 IX ZAMBOANGA SIBUGAY MABUHAY 68.86 5.68 8.2511 IX ZAMBOANGA DEL NORTE MANUKAN 68.24 5.40 7.9112 IX ZAMBOANGA DEL NORTE SIBUCO 68.21 5.24 7.6813 IX ZAMBOANGA DEL NORTE JOSE DALMAN (PONOT) 68.00 5.87 8.6314 X LANAO DEL NORTE NUNUNGAN 67.87 4.13 6.0715 CAR BENGUET KIBUNGAN 67.86 11.31 16.6716 ARMM MAGUINDANAO GUINDULUNGAN 67.68 6.81 10.0617 X LANAO DEL NORTE MUNAI 67.47 3.62 5.3618 X LANAO DEL NORTE TANGCAL 67.36 4.30 6.3819 CAR ABRA LACUB 67.23 9.53 14.1720 ARMM MAGUINDANAO GEN. S. K. PENDATUN 67.12 7.12 10.6117Dissemination Forum <strong>of</strong> <strong>the</strong> <strong>2009</strong> SAE <strong>of</strong> <strong>Poverty</strong> StatisticsZVJAlbacea and RAVirola/30 July 2012NATIONAL STATISTICAL COORDINATION BOARD
IV. <strong>2009</strong> Intercensal SAE <strong>of</strong> <strong>Poverty</strong> <strong>Incidence</strong><strong>2009</strong> Poorest <strong>Municipal</strong>ities Based on SAE18Rank Region Province <strong>Municipal</strong>ity<strong>Poverty</strong><strong>Incidence</strong>StandardErrorCoefficient<strong>of</strong> Variation21 ARMM LANAO DEL SUR TAGOLOAN II 67.08 10.21 15.2222 VII BOHOL PILAR 67.08 3.86 5.75PANGLIMA ESTINO (NEW23 ARMM SULUPANAMAO) 66.78 8.44 12.6424 X LANAO DEL NORTE POONA PIAGAPO 66.75 3.89 5.8325 CARAGA AGUSAN DEL SUR LA PAZ 66.71 3.94 5.9126 XI DAVAO DEL SUR DON MARCELINO 66.54 5.36 8.0627 IX ZAMBOANGA SIBUGAY TALUSAN 66.52 7.83 11.7728 ARMM MAGUINDANAO KABUNTALAN (TUMBAO) 66.48 6.87 10.3329 IX ZAMBOANGA DEL NORTE PRES. MANUEL A. ROXAS 66.34 4.74 7.1430 IX ZAMBOANGA DEL NORTE BACUNGAN (LEON T. POSTIGO) 65.96 6.21 9.4131 IX ZAMBOANGA DEL NORTE KALAWIT 65.83 6.80 10.3332 IX ZAMBOANGA DEL NORTE SERGIO OSMEÑA SR. 65.80 5.55 8.4333 X MISAMIS OCCIDENTAL DON VICTORIANO CHIONGBIAN 65.66 5.15 7.8434 ARMM MAGUINDANAO PAGLAT 65.43 8.07 12.3335 VIII NORTHERN SAMAR SILVINO LOBOS 64.78 3.83 5.9136 VII BOHOL SAN ISIDRO 64.01 4.84 7.5637 XI DAVAO DEL SUR MALITA 63.82 3.51 5.5038 VII BOHOL BIEN UNIDO 63.72 3.98 6.2539 XII SULTAN KUDARAT PALIMBANG 63.68 3.95 6.20Dissemination 40 Forum IX <strong>of</strong> <strong>the</strong> ZAMBOANGA <strong>2009</strong> SAE DEL <strong>of</strong> NORTE <strong>Poverty</strong> Statistics SIOCON NATIONAL STATISTICAL 63.56 COORDINATION 5.83 BOARD 9.17ZVJAlbacea and RAVirola/30 July 2012
IV. <strong>2009</strong> Intercensal SAE <strong>of</strong> <strong>Poverty</strong> <strong>Incidence</strong>Among <strong>the</strong> 40 identified poorestmunicipalities in 2003 based on SAEoOnly 14 <strong>of</strong> <strong>the</strong>se 40 are found in <strong>the</strong> 40poorest municipalities in <strong>2009</strong>oAll have lower poverty incidences in<strong>2009</strong>oOnly 10 <strong>of</strong> <strong>the</strong>se 40 municipalitiesexhibit an insignificant changeoThe remaining 30 exhibit significantdecrease in <strong>the</strong> poverty incidence.19Dissemination Forum <strong>of</strong> <strong>the</strong> <strong>2009</strong> SAE <strong>of</strong> <strong>Poverty</strong> StatisticsZVJAlbacea and RAVirola/30 July 2012NATIONAL STATISTICAL COORDINATION BOARD
V. Lessons Learned• The SAE methodology employed in <strong>the</strong>Project made use <strong>of</strong> <strong>the</strong> Elbers, Lanjouw,and Lanjouw (ELL) methodology developedby <strong>the</strong> WB was modified to be used duringnon-censal years.• The modified ELL method was able toprovide municipality and city povertyincidence estimates for all municipalitiesand cities.• The estimates obtained can be used notonly by <strong>the</strong> local government but also by<strong>the</strong> national government in pinpointing <strong>the</strong>municipalities in <strong>the</strong> province that needs<strong>the</strong> poverty alleviation program.20Dissemination Forum <strong>of</strong> <strong>the</strong> <strong>2009</strong> SAE <strong>of</strong> <strong>Poverty</strong> StatisticsZVJAlbacea and RAVirola/30 July 2012NATIONAL STATISTICAL COORDINATION BOARD
Maraming Salamat po!URL: http://www.nscb.gov.phe-mail: info@nscb.gov.ph21Dissemination Forum <strong>of</strong> <strong>the</strong> <strong>2009</strong> SAE <strong>of</strong> <strong>Poverty</strong> StatisticsZVJAlbacea and RAVirola/30 July 2012NATIONAL STATISTICAL COORDINATION BOARD