Regional Stat Watch - NSCB
Regional Stat Watch - NSCB
Regional Stat Watch - NSCB
- No tags were found...

Create successful ePaper yourself
Turn your PDF publications into a flip-book with our unique Google optimized e-Paper software.
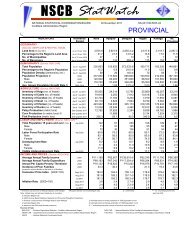
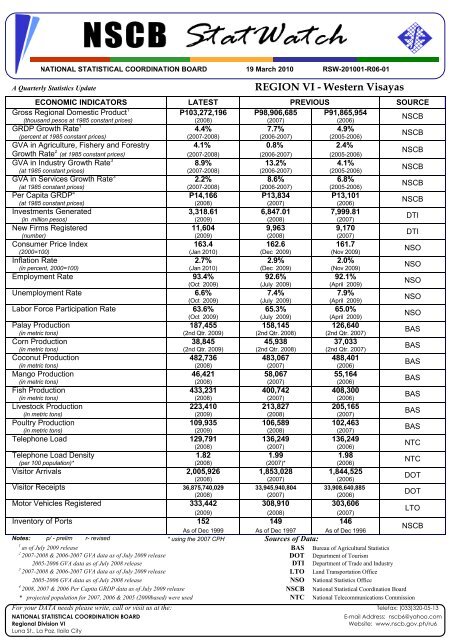
NATIONAL STATISTICAL COORDINATION BOARD 19 March 2010 RSW-201001-R06-01A Quarterly <strong>Stat</strong>istics Update REGION VI - Western VisayasECONOMIC INDICATORS LATEST PREVIOUS SOURCEGross <strong>Regional</strong> Domestic Product 1GRDP Growth Rate 1GVA in Agriculture, Fishery and ForestryGVA in Industry Growth Rate 3GVA in Services Growth Rate 3Per Capita GRDP 4Investments GeneratedNew Firms RegisteredConsumer Price IndexInflation RateEmployment RateUnemployment RateLabor Force Participation RatePalay ProductionCorn ProductionCoconut ProductionMango ProductionFish ProductionLivestock ProductionPoultry ProductionTelephone LoadTelephone Load DensityVisitor ArrivalsVisitor ReceiptsMotor Vehicles RegisteredInventory of PortsP103,272,1964.4%4.1%8.9%2.2%P14,1663,318.6111,604163.42.7%93.4%6.6%63.6%187,45538,845482,73646,421433,231223,410109,935129,7911.822,005,92636,875,740,029333,442152P98,906,6857.7%0.8%13.2%8.6%P13,8346,847.019,963162.62.9%92.6%7.4%65.3%158,14545,938483,06758,067400,742213,827106,589136,2491.991,853,02833,945,940,804308,910149P91,865,9544.9%2.4%4.1%6.8%P13,1017,999.819,170161.72.0%92.1%7.9%65.0%126,64037,033488,40155,164408,300205,165102,463136,2491.981,844,52533,908,640,885303,606146(thousand pesos at 1985 constant prices)(percent at 1985 constant prices)Growth Rate 2 (at 1985 constant prices)(at 1985 constant prices)(at 1985 constant prices)(at 1985 constant prices)(in million pesos)(number)(2000=100)(in percent, 2000=100)(in metric tons)(in metric tons)(in metric tons)(in metric tons)(in metric tons)(in metric tons)(in metric tons)(per 100 population)*(2008)(2007-2008)(2007-2008)(2007-2008)(2007-2008)(2008)(2009)(2009)(Jan 2010)(Jan 2010)(Oct 2009)(Oct 2009)(Oct 2009)(2nd Qtr. 2009)(2nd Qtr. 2009)(2008)(2008)(2008)(2009)(2009)(2008)(2008)(2008)(2008)(2009)As of Dec 1999(2007)(2006-2007)(2006-2007)(2006-2007)(2006-2007)(2007)(2008)(2008)(Dec 2009)(Dec 2009)(July 2009)(July 2009)(July 2009)(2nd Qtr. 2008)(2nd Qtr. 2008)(2007)(2007)(2007)(2008)(2008)(2007)(2007)*(2007)(2007)(2008)As of Dec 1997(2006)(2005-2006)(2005-2006)(2005-2006)(2005-2006)(2006)(2007)(2007)(Nov 2009)(Nov 2009)(April 2009)(April 2009)(April 2009)(2nd Qtr. 2007)(2nd Qtr. 2007)(2006)(2006)(2006)(2007)(2007)(2006)(2006)(2006)(2006)(2007)As of Dec 1996<strong>NSCB</strong><strong>NSCB</strong><strong>NSCB</strong><strong>NSCB</strong><strong>NSCB</strong><strong>NSCB</strong>DTIDTINSONSONSONSONSOBASBASBASBASBASBASBASNTCNTCDOTDOTLTO<strong>NSCB</strong>Notes: p/ - prelim r- revised * using the 2007 CPH Sources of Data:1 as of July 2009 release BAS Bureau of Agricultural <strong>Stat</strong>istics2 2007-2008 & 2006-2007 GVA data as of July 2009 release DOT Department of Tourism2005-2006 GVA data as of July 2008 release DTI Department of Trade and Industry3 2007-2008 & 2006-2007 GVA data as of July 2009 release LTO Land Transportation Office2005-2006 GVA data as of July 2008 release NSO National <strong>Stat</strong>istics Office4 2008, 2007 & 2006 Per Capita GRDP data as of July 2009 release <strong>NSCB</strong> National <strong>Stat</strong>istical Coordination Board* projected population for 2007, 2006 & 2005 (2000based) were used NTC National Telecommunications CommissionFor your DATA needs please write, call or visit us at the: Telefax: (033)320-05-13NATIONAL STATISTICAL COORDINATION BOARD E-mail Address: nscb6@yahoo.com<strong>Regional</strong> Division VI Website: www.nscb.gov.ph/ru6Luna St., La Paz, Iloilo City
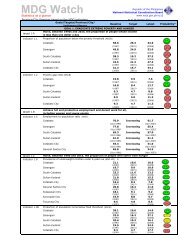
NATIONAL STATISTICAL COORDINATION BOARD 19 March 2010 RSW-201001-R06-01A Quarterly <strong>Stat</strong>istics Update REGION VI - Western VisayasSOCIAL INDICATORS LATEST PREVIOUS SOURCEAnnual Per Capita Poverty ThresholdAll Areas 14,552 13,820 12,275Urban 14,759 13,835 … TWGIS, <strong>NSCB</strong>Rural 14,515 13,817 …(2006) revised (2005) (2000)Poverty Incidence Among Families (in percent)All Areas 31.1% 31.4% 36.7%Urban … … … TWGIS, <strong>NSCB</strong>Rural … … …(2006) (2003) (2000)Average Family Income P129,905 a/ P112,593 a/ P109,600 a/Average Family Expenditures P14,405 a/ P98,332 a/ P94,704 a/NSO(2006) final (2003) final (2000) finalPopulationPopulation DensityAverage Annual Population Growth RateProjected Age Dependency Ratio6,844338.51.35%65.9 a/6,208307.01.56%76.05,777285.71.30%79.1(in thousands)(persons per sq. km.)(As of August 1, 2007 Census )(As of August 1, 2007 Census )(2000-2007)(Projected as of 2003)(As of May 1, 2000 Census )(As of May 1, 2000 Census )(1995-2000)(Census as of Sep 1,1995)(Census as of Sep 1,1995)(Census as of Sep 1,1995)(1990-1995 Census based)(Census as of May 1,1990)NSONSONSONSOLife Expectancy at Birth (in number of years)Female 73.16 a/ 72.89 a/ 72.62 a/Male 67.30 a/ 66.95 a/ 66.60 a/NSO(2005) (2004) (2003)Total Fertility RateCrude Birth RateCrude Death RateCrude Rate of Natural IncreaseFunctional Literacy RateSimple Literacy RateElementary EnrolmentSecondary Enrolment3.27 a/24.3 a/6.1 a/18.2 a/81.5%92.8%980,603459,7353.35 a/24.7 a/6.2 a/18.5 a/80.9%91.9%980,076459,5053.43 a/25.2 a/6.3 a/18.9 a/71.3%87.7%982,163458,493(no. of children within reproductive years)(births per 1,000 population)(deaths per 1,000 population)(persons per 1,000 population)(public school)(public school)(2005)(2005)(2005)(2005)(2003)(2003)(SY 2007-2008)(SY 2007-2008)(2004)(2004)(2004)(2004)(Nov 1994)(Nov 1994)(SY 2006-2007)(SY 2006-2007)(2003)(2003)(2003)(2003)(Jul 1989)(Jul 1989)(SY 2005-2006)(SY 2005-2006)NSONSONSONSONSONSODepEdDepEdCrime Volume 13,316 13,892 13,930Crime Solution Efficiency 5.44% 6.69% 5.13%PNP(4th Quarter 2009) (3rd Quarter 2009) (2nd Quarter 2009)Fire Incidence 922 709 1,036Fire Damages to Property (in thousand Php) P174,036,240.00 P165,308,856.00 P126,936,284.55 BFP(2009) (2008) (2007)- Nil * projected population for 2008, 2007 and 2006 were useda/ - Based from the 1995 Census-Based National, <strong>Regional</strong> and Provincial Population Projections*Sources of data:95-CBNRPP 1995-Census Based National & <strong>Regional</strong> Population ProjectionsCHEDNSOCommission on Higher EducationNational <strong>Stat</strong>istics OfficeTWGIS Technical Working Group on Income <strong>Stat</strong>istics DepEd Department of Education<strong>NSCB</strong> National <strong>Stat</strong>istical Coordination Board PNP Philippine National PoliceFLEMMS Functional Literacy, Education and Mass Media Survey BFP Bureau of Fire ProtectionFor your DATA needs please write, call or visit us at the:NATIONAL STATISTICAL COORDINATION BOARD Telefax: (033) 320-05-13<strong>Regional</strong> Division 6E-mail Address: nscb6@yahoo.comLuna St., La Paz, Iloilo CityWebsite: www.nscb.gov.ph/ru6