A Control System and API for an Elevation over Azimuth Tracking ...
A Control System and API for an Elevation over Azimuth Tracking ...
A Control System and API for an Elevation over Azimuth Tracking ...

You also want an ePaper? Increase the reach of your titles
YUMPU automatically turns print PDFs into web optimized ePapers that Google loves.
A <strong>Control</strong> <strong>System</strong> <strong><strong>an</strong>d</strong> Application ProgramInterface (<strong>API</strong>) <strong>for</strong> <strong>an</strong> <strong>Elevation</strong> Over<strong>Azimuth</strong> <strong>Tracking</strong> PedestalJames Callum RussellA dissertation submitted to the Department of Electrical Engineering,University of Cape Town, in partial fulfilment of the requirements<strong>for</strong> the degree of Bachelor of Science in Electrical <strong><strong>an</strong>d</strong> Computer Engineering.20 October 2008
DeclarationI declare that this dissertation is my own, unaided work. It is being submitted in partial fulfilment <strong>for</strong>the degree of Bachelor of Science in Electrical <strong><strong>an</strong>d</strong> Computer Engineering at the University of CapeTown. It has not been submitted be<strong>for</strong>e <strong>for</strong> <strong>an</strong>y degree or examination in this or <strong>an</strong>y other university.Signature of Author . . . . . . . . . . . . . . . . . . . . . . . . . . . . . . . . . . . . . . . . . . . . . . . . . . . . . . . . . . . . . . . . . . . . . . . .Cape Town20 October 2008i
AbstractThis project concerns the design <strong><strong>an</strong>d</strong> implementation of a control system <strong>for</strong> <strong>an</strong> <strong>Elevation</strong> <strong>over</strong> <strong>Azimuth</strong><strong>Tracking</strong> Pedestal as well as the creation of <strong>an</strong> Application Program Interface (<strong>API</strong>). The <strong>API</strong>provides a number of methods to control the movement <strong><strong>an</strong>d</strong> position of the pedestal on both its elevation<strong><strong>an</strong>d</strong> azimuth axes. The control algorithm used was created using the statistical <strong>an</strong>alysis of keyfactors affecting the accurate positioning of the pedestal on its axes. The system was made to runin <strong>an</strong> Open Source environment (Ubuntu 8.04.1 LTS - Hardy Heron) with a Linux kernel version of2.6.24-21. The accuracy of the azimuth axis positioning was calculated to be within 0.2915 ◦ with ast<strong><strong>an</strong>d</strong>ard deviation of 0.0544 ◦ <strong><strong>an</strong>d</strong> the accuracy of the elevation axis positioning was calculated to bewithin 0.0193 ◦ with a st<strong><strong>an</strong>d</strong>ard deviation of 0.0308 ◦ .ii
AcknowledgementsI would like to th<strong>an</strong>k my family <strong>for</strong> their continued support <strong><strong>an</strong>d</strong> encouragement throughout myundergraduate degree at the University of Cape Town. Their advice <strong><strong>an</strong>d</strong> expert proof reading skillswere invaluable to me during this project.I would also like to th<strong>an</strong>k Professor Inggs from the University of Cape Town <strong>for</strong> his supervision <strong><strong>an</strong>d</strong>guid<strong>an</strong>ce throughout this project.iii
ContentsDeclarationAbstractAcknowledgementsiiiiii1 Introduction 21.1 Background to Investigation . . . . . . . . . . . . . . . . . . . . . . . . . . . . . . 21.2 User Specification . . . . . . . . . . . . . . . . . . . . . . . . . . . . . . . . . . . . 31.2.1 User Requirements . . . . . . . . . . . . . . . . . . . . . . . . . . . . . . . 41.2.2 Functional Requirements . . . . . . . . . . . . . . . . . . . . . . . . . . . . 41.3 Project Scope . . . . . . . . . . . . . . . . . . . . . . . . . . . . . . . . . . . . . . 51.4 Requirements Analysis . . . . . . . . . . . . . . . . . . . . . . . . . . . . . . . . . 61.5 Dissertation Overview . . . . . . . . . . . . . . . . . . . . . . . . . . . . . . . . . 72 Description of Existing Hardware 112.1 Synchros . . . . . . . . . . . . . . . . . . . . . . . . . . . . . . . . . . . . . . . . 112.1.1 <strong>Control</strong> Synchros . . . . . . . . . . . . . . . . . . . . . . . . . . . . . . . . 112.1.2 Types of <strong>Control</strong> Synchros . . . . . . . . . . . . . . . . . . . . . . . . . . . 132.1.3 Synchros on the Pedestal . . . . . . . . . . . . . . . . . . . . . . . . . . . . 142.2 The 76CS1 Synchro to Digital Card . . . . . . . . . . . . . . . . . . . . . . . . . . 142.2.1 Connecting Synchros to the 76CS1 . . . . . . . . . . . . . . . . . . . . . . 152.3 The <strong>Elevation</strong> Axis limit switch . . . . . . . . . . . . . . . . . . . . . . . . . . . . 162.4 Mech<strong>an</strong>ical Gearing . . . . . . . . . . . . . . . . . . . . . . . . . . . . . . . . . . . 163 Hardware Design <strong><strong>an</strong>d</strong> Unit Testing 183.1 Unit Testing . . . . . . . . . . . . . . . . . . . . . . . . . . . . . . . . . . . . . . . 18iv
CONTENTS3.2 Interface Between the Computer <strong><strong>an</strong>d</strong> the <strong>Control</strong> Hardware . . . . . . . . . . . . . . 183.3 Simulating the Parallel Port . . . . . . . . . . . . . . . . . . . . . . . . . . . . . . . 193.4 Interpreting the Computer Output . . . . . . . . . . . . . . . . . . . . . . . . . . . 193.4.1 DAC Unit Test . . . . . . . . . . . . . . . . . . . . . . . . . . . . . . . . . 203.5 <strong>Control</strong>ling the speed of the motors . . . . . . . . . . . . . . . . . . . . . . . . . . . 213.5.1 Variable Voltage <strong>Control</strong>ler . . . . . . . . . . . . . . . . . . . . . . . . . . . 213.5.2 PWM <strong>Control</strong>ler . . . . . . . . . . . . . . . . . . . . . . . . . . . . . . . . 223.5.3 Software PWM . . . . . . . . . . . . . . . . . . . . . . . . . . . . . . . . . 233.5.4 PWM Unit Test . . . . . . . . . . . . . . . . . . . . . . . . . . . . . . . . . 233.6 Bi-directional Motor <strong>Control</strong> . . . . . . . . . . . . . . . . . . . . . . . . . . . . . . 243.6.1 L298 Dual H-Bridge IC . . . . . . . . . . . . . . . . . . . . . . . . . . . . 253.6.2 LMD18200 H-Bridge . . . . . . . . . . . . . . . . . . . . . . . . . . . . . . 273.7 Limit Switch Logic . . . . . . . . . . . . . . . . . . . . . . . . . . . . . . . . . . . 283.7.1 Logic Circuit Unit Test . . . . . . . . . . . . . . . . . . . . . . . . . . . . . 293.8 Voltage Regulator . . . . . . . . . . . . . . . . . . . . . . . . . . . . . . . . . . . . 293.9 76CS1 Junction Box . . . . . . . . . . . . . . . . . . . . . . . . . . . . . . . . . . 304 Hardware Implementation <strong><strong>an</strong>d</strong> Functional Testing 324.1 PCB Implementation . . . . . . . . . . . . . . . . . . . . . . . . . . . . . . . . . . 324.1.1 <strong>Control</strong> Circuit PCB . . . . . . . . . . . . . . . . . . . . . . . . . . . . . . 324.1.2 Limit Switch Logic PCB . . . . . . . . . . . . . . . . . . . . . . . . . . . . 354.2 Functional Testing . . . . . . . . . . . . . . . . . . . . . . . . . . . . . . . . . . . 375 Experimentation 395.1 Experiment 1 . . . . . . . . . . . . . . . . . . . . . . . . . . . . . . . . . . . . . . 395.1.1 Aim . . . . . . . . . . . . . . . . . . . . . . . . . . . . . . . . . . . . . . . 395.1.2 Method . . . . . . . . . . . . . . . . . . . . . . . . . . . . . . . . . . . . . 395.1.3 Results . . . . . . . . . . . . . . . . . . . . . . . . . . . . . . . . . . . . . 395.1.4 Conclusions . . . . . . . . . . . . . . . . . . . . . . . . . . . . . . . . . . . 425.2 Experiment 2 . . . . . . . . . . . . . . . . . . . . . . . . . . . . . . . . . . . . . . 425.2.1 Aim . . . . . . . . . . . . . . . . . . . . . . . . . . . . . . . . . . . . . . . 425.2.2 Method . . . . . . . . . . . . . . . . . . . . . . . . . . . . . . . . . . . . . 425.2.3 Results . . . . . . . . . . . . . . . . . . . . . . . . . . . . . . . . . . . . . 425.2.4 Conclusions . . . . . . . . . . . . . . . . . . . . . . . . . . . . . . . . . . . 44v
CONTENTS5.3 Experiment 3 . . . . . . . . . . . . . . . . . . . . . . . . . . . . . . . . . . . . . . 445.3.1 Aim . . . . . . . . . . . . . . . . . . . . . . . . . . . . . . . . . . . . . . . 445.3.2 Method . . . . . . . . . . . . . . . . . . . . . . . . . . . . . . . . . . . . . 445.3.3 Results . . . . . . . . . . . . . . . . . . . . . . . . . . . . . . . . . . . . . 465.3.4 Conclusions . . . . . . . . . . . . . . . . . . . . . . . . . . . . . . . . . . . 475.4 Experiment 4 . . . . . . . . . . . . . . . . . . . . . . . . . . . . . . . . . . . . . . 475.4.1 Aim . . . . . . . . . . . . . . . . . . . . . . . . . . . . . . . . . . . . . . . 475.4.2 Method . . . . . . . . . . . . . . . . . . . . . . . . . . . . . . . . . . . . . 475.4.3 Results . . . . . . . . . . . . . . . . . . . . . . . . . . . . . . . . . . . . . 495.4.4 Conclusions . . . . . . . . . . . . . . . . . . . . . . . . . . . . . . . . . . . 505.5 Experiment 5 . . . . . . . . . . . . . . . . . . . . . . . . . . . . . . . . . . . . . . 505.5.1 Aim . . . . . . . . . . . . . . . . . . . . . . . . . . . . . . . . . . . . . . . 505.5.2 Method . . . . . . . . . . . . . . . . . . . . . . . . . . . . . . . . . . . . . 515.5.3 Results . . . . . . . . . . . . . . . . . . . . . . . . . . . . . . . . . . . . . 515.5.4 Conclusions . . . . . . . . . . . . . . . . . . . . . . . . . . . . . . . . . . . 516 Software Design 526.1 Installing the 76CS1 . . . . . . . . . . . . . . . . . . . . . . . . . . . . . . . . . . 526.2 Real-time programming . . . . . . . . . . . . . . . . . . . . . . . . . . . . . . . . . 536.2.1 Hard Real-Time . . . . . . . . . . . . . . . . . . . . . . . . . . . . . . . . . 536.2.2 Soft Real-Time . . . . . . . . . . . . . . . . . . . . . . . . . . . . . . . . . 536.2.3 The Pedestal <strong>Control</strong>ler . . . . . . . . . . . . . . . . . . . . . . . . . . . . . 536.3 Multithreaded Programming . . . . . . . . . . . . . . . . . . . . . . . . . . . . . . 546.3.1 PThreads . . . . . . . . . . . . . . . . . . . . . . . . . . . . . . . . . . . . 546.4 <strong>Control</strong>ling the Movement of the Pedestal . . . . . . . . . . . . . . . . . . . . . . . 546.5 <strong>Control</strong> Algorithm . . . . . . . . . . . . . . . . . . . . . . . . . . . . . . . . . . . 566.6 Description of Code . . . . . . . . . . . . . . . . . . . . . . . . . . . . . . . . . . . 586.7 Structures . . . . . . . . . . . . . . . . . . . . . . . . . . . . . . . . . . . . . . . . 586.7.1 struct Positions . . . . . . . . . . . . . . . . . . . . . . . . . . . . . . . . . 586.8 Variables . . . . . . . . . . . . . . . . . . . . . . . . . . . . . . . . . . . . . . . . 586.8.1 double AcoarseSpeeds[6] . . . . . . . . . . . . . . . . . . . . . . . . . . . . 586.8.2 double AfineSpeeds[3] . . . . . . . . . . . . . . . . . . . . . . . . . . . . . 586.8.3 double EcoarseSpeeds[6] . . . . . . . . . . . . . . . . . . . . . . . . . . . . 58vi
CONTENTS6.8.4 double EfineSpeeds[3] . . . . . . . . . . . . . . . . . . . . . . . . . . . . . 596.8.5 int A_ch<strong>an</strong>, E_ch<strong>an</strong> . . . . . . . . . . . . . . . . . . . . . . . . . . . . . . . 596.8.6 double Theta, Phi . . . . . . . . . . . . . . . . . . . . . . . . . . . . . . . . 596.9 Methods . . . . . . . . . . . . . . . . . . . . . . . . . . . . . . . . . . . . . . . . . 596.9.1 int ped_Initialise(int a_ch<strong>an</strong>, int e_ch<strong>an</strong>) . . . . . . . . . . . . . . . . . . . . 596.9.2 void* ped_Emoveto(void *arg) . . . . . . . . . . . . . . . . . . . . . . . . . 606.9.3 void* ped_Emovesmall(void *arg) . . . . . . . . . . . . . . . . . . . . . . . 606.9.4 void* ped_Amoveto(void *arg) . . . . . . . . . . . . . . . . . . . . . . . . 606.9.5 void* ped_Amovesmall(void *arg) . . . . . . . . . . . . . . . . . . . . . . . 606.9.6 int ped_GetTheta() . . . . . . . . . . . . . . . . . . . . . . . . . . . . . . . 606.9.7 int ped_GetPhi() . . . . . . . . . . . . . . . . . . . . . . . . . . . . . . . . 606.9.8 void ped_Abort() . . . . . . . . . . . . . . . . . . . . . . . . . . . . . . . . 606.9.9 int ped_MoveTo(double theta, double phi) . . . . . . . . . . . . . . . . . . . 616.9.10 void* ped_ThrMoveTo(void *arg) . . . . . . . . . . . . . . . . . . . . . . . 616.9.11 int ped_raster(double theta1, double phi1, double theta2, double phi2, doubleAinc, double Einc) . . . . . . . . . . . . . . . . . . . . . . . . . . . . . 617 <strong>System</strong> Validation 637.1 Accept<strong>an</strong>ce Testing . . . . . . . . . . . . . . . . . . . . . . . . . . . . . . . . . . . 637.1.1 Test 1 . . . . . . . . . . . . . . . . . . . . . . . . . . . . . . . . . . . . . . 637.1.2 Test 2 . . . . . . . . . . . . . . . . . . . . . . . . . . . . . . . . . . . . . . 657.1.3 Test 3 . . . . . . . . . . . . . . . . . . . . . . . . . . . . . . . . . . . . . . 677.1.4 Test 4 . . . . . . . . . . . . . . . . . . . . . . . . . . . . . . . . . . . . . . 687.1.5 Test 5 . . . . . . . . . . . . . . . . . . . . . . . . . . . . . . . . . . . . . . 697.2 Determining the Accuracy of the <strong>System</strong> . . . . . . . . . . . . . . . . . . . . . . . . 708 Analysis of Results 718.1 Functional Testing of Hardware . . . . . . . . . . . . . . . . . . . . . . . . . . . . 718.2 Accept<strong>an</strong>ce Testing . . . . . . . . . . . . . . . . . . . . . . . . . . . . . . . . . . . 718.3 Determining the Accuracy of the <strong>System</strong> . . . . . . . . . . . . . . . . . . . . . . . . 729 Conclusions 7310 Recommendations 75Bibliography 76vii
List of Figures1.1 Axes of movement of a typical <strong>Elevation</strong> <strong>over</strong> <strong>Azimuth</strong> <strong>Tracking</strong> Pedestal . . . . . . 21.2 <strong>Elevation</strong> <strong>over</strong> <strong>Azimuth</strong> <strong>Tracking</strong> Pedestal . . . . . . . . . . . . . . . . . . . . . . . 31.3 Proposed system showing scope of project . . . . . . . . . . . . . . . . . . . . . . . 62.1 Internal structure of a synchro control tr<strong>an</strong>smitter <strong><strong>an</strong>d</strong> its electrical representation(taken from [1]) . . . . . . . . . . . . . . . . . . . . . . . . . . . . . . . . . . . . . 122.2 Synchro output voltages as shaft rotates at 3 RPM (taken from [1]) . . . . . . . . . . 132.3 Limit switch implementation . . . . . . . . . . . . . . . . . . . . . . . . . . . . . . 163.1 Parallel Port simulation circuit . . . . . . . . . . . . . . . . . . . . . . . . . . . . . 193.2 Parallel Port output to DAC input . . . . . . . . . . . . . . . . . . . . . . . . . . . . 203.3 DAC circuit diagram . . . . . . . . . . . . . . . . . . . . . . . . . . . . . . . . . . 203.4 Variable voltage controller . . . . . . . . . . . . . . . . . . . . . . . . . . . . . . . 213.5 PWM circuit [2] . . . . . . . . . . . . . . . . . . . . . . . . . . . . . . . . . . . . . 223.6 Visual representation of how the PWM controller works [2] . . . . . . . . . . . . . . 233.7 Combined duty cycle output . . . . . . . . . . . . . . . . . . . . . . . . . . . . . . 243.8 Basic H-Bridge circuit . . . . . . . . . . . . . . . . . . . . . . . . . . . . . . . . . 253.9 L298 block diagram [3] . . . . . . . . . . . . . . . . . . . . . . . . . . . . . . . . . 263.10 LMD18200 block diagram [4] . . . . . . . . . . . . . . . . . . . . . . . . . . . . . 273.11 Limit switch logic circuit . . . . . . . . . . . . . . . . . . . . . . . . . . . . . . . . 293.12 Voltage regulator circuit diagram . . . . . . . . . . . . . . . . . . . . . . . . . . . . 303.13 Top view of junction box showing internal wiring . . . . . . . . . . . . . . . . . . . 303.14 Side view of junction box showing p<strong>an</strong>el mounted DIN sockets . . . . . . . . . . . . 314.1 <strong>Control</strong> circuit schematic . . . . . . . . . . . . . . . . . . . . . . . . . . . . . . . . 334.2 Routed PCB of control circuit . . . . . . . . . . . . . . . . . . . . . . . . . . . . . 344.3 Routed PCB of logic circuit . . . . . . . . . . . . . . . . . . . . . . . . . . . . . . . 35viii
LIST OF FIGURES4.4 Limit Switch logic circuit schematic . . . . . . . . . . . . . . . . . . . . . . . . . . 365.1 St<strong><strong>an</strong>d</strong>ard Normal Distribution PDF of results <strong>for</strong> Experiment 1 . . . . . . . . . . . . 415.2 St<strong><strong>an</strong>d</strong>ard Normal Distribution PDF of results <strong>for</strong> Experiment 2 . . . . . . . . . . . . 445.3 St<strong><strong>an</strong>d</strong>ard Normal Distribution PDF of results <strong>for</strong> Experiment 3 . . . . . . . . . . . . 475.4 St<strong><strong>an</strong>d</strong>ard Normal Distribution PDF of results <strong>for</strong> Experiment 4 . . . . . . . . . . . . 506.1 Speed vs. Dist<strong>an</strong>ce to setpoint . . . . . . . . . . . . . . . . . . . . . . . . . . . . . 556.2 Flowchart of coarse speed control algorithm . . . . . . . . . . . . . . . . . . . . . . 566.3 Flowchart of fine speed control algorithm . . . . . . . . . . . . . . . . . . . . . . . 576.4 Raster Sc<strong>an</strong> . . . . . . . . . . . . . . . . . . . . . . . . . . . . . . . . . . . . . . . 62ix
List of Tables2.1 76CS1 Pin Configuration <strong>for</strong> S/D Ch<strong>an</strong>nels [5] . . . . . . . . . . . . . . . . . . . . 153.1 Simulated DAC inputs <strong><strong>an</strong>d</strong> corresponding outputs . . . . . . . . . . . . . . . . . . . 213.2 PWM circuit inputs <strong><strong>an</strong>d</strong> corresponding outputs . . . . . . . . . . . . . . . . . . . . 243.3 State chart <strong>for</strong> limit switch logic circuit . . . . . . . . . . . . . . . . . . . . . . . . 284.1 Functional test inputs <strong><strong>an</strong>d</strong> outputs . . . . . . . . . . . . . . . . . . . . . . . . . . . 385.1 Results <strong>for</strong> Experiment 1 . . . . . . . . . . . . . . . . . . . . . . . . . . . . . . . . 405.2 Results <strong>for</strong> Experiment 2 . . . . . . . . . . . . . . . . . . . . . . . . . . . . . . . . 435.3 Results <strong>for</strong> Experiment 3 . . . . . . . . . . . . . . . . . . . . . . . . . . . . . . . . 465.4 Results <strong>for</strong> Experiment 4 . . . . . . . . . . . . . . . . . . . . . . . . . . . . . . . . 496.1 Ch<strong>an</strong>ges made to 76CS1 files . . . . . . . . . . . . . . . . . . . . . . . . . . . . . . 526.2 Threshold value <strong>for</strong> each speed . . . . . . . . . . . . . . . . . . . . . . . . . . . . . 551
Chapter 1Introduction1.1 Background to InvestigationM<strong>an</strong>y applications such as those in astronomy, radar <strong><strong>an</strong>d</strong> various military applications [6] requireaccurate tracking <strong><strong>an</strong>d</strong> positioning of objects in the sky. The use of <strong>an</strong> <strong>Elevation</strong> <strong>over</strong> <strong>Azimuth</strong><strong>Tracking</strong> Pedestal is one method that accomplishes this. <strong>Elevation</strong> <strong>over</strong> <strong>Azimuth</strong> <strong>Tracking</strong> Pedestalshave two axes of movement: azimuth (horizontal) <strong><strong>an</strong>d</strong> elevation (vertical). Its name stems from thefact that the elevation axis is situated above the azimuth axis. The <strong>Tracking</strong> Pedestal c<strong>an</strong> rotate a full360 ◦ on the azimuth axis but is usually limited to a 90 ◦ r<strong>an</strong>ge on the elevation axis. This design hasbeen in common use <strong>for</strong> decades, however it does have a major functional limitation. If the targetbeing tracked passes directly <strong>over</strong> the pedestal, a 180 ◦ movement is required on the azimuth axisto continue tracking [7]. This me<strong>an</strong>s that the pedestal has to reacquire the target once the rotationis complete. Figure 1.1 shows the axes of movement of a typical <strong>Elevation</strong> <strong>over</strong> <strong>Azimuth</strong> <strong>Tracking</strong>Pedestal. The φ <strong><strong>an</strong>d</strong> θ symbols denote the <strong>an</strong>gles of rotation from the 0 ◦ position <strong>for</strong> the elevation<strong><strong>an</strong>d</strong> azimuth axes respectively.Figure 1.1: Axes of movement of a typical <strong>Elevation</strong> <strong>over</strong> <strong>Azimuth</strong> <strong>Tracking</strong> Pedestal2
1. INTRODUCTIONThe Radar Remote Sensing Group at UCT has three <strong>Elevation</strong> <strong>over</strong> <strong>Azimuth</strong> <strong>Tracking</strong> Pedestalswhich were previously used on Navy ships to mount Electronic Warfare (EW) Radar Jammers. Oneof these pedestals was used <strong>for</strong> this project. Each axis of the pedestal used has a 28V DC motor tocontrol the position of the <strong>an</strong>tenna. Synchro <strong>Control</strong> Tr<strong>an</strong>s<strong>for</strong>mers are also present on each axis tocalculate the <strong>an</strong>gular position of the <strong>an</strong>tenna. There is a single limit switch which is activated whenthe elevation axis moves out of bounds (i.e less th<strong>an</strong> 0 ◦ or greater th<strong>an</strong> 60 ◦ ). The pedestal used <strong>for</strong>this project has a limited r<strong>an</strong>ge of 60 ◦ on the elevation axis <strong><strong>an</strong>d</strong> if it was driven out of this r<strong>an</strong>ge, itcould be damaged.Figure 1.2: <strong>Elevation</strong> <strong>over</strong> <strong>Azimuth</strong> <strong>Tracking</strong> PedestalPrevious students from UCT have used the pedestals <strong>for</strong> various projects, but have suffered inaccuraciesin the movements of the axes or had trouble interfacing with the hardware. The author workedat the university <strong>for</strong> 6 weeks as per the requirements <strong>for</strong> the EEE3000X course (3 rd year vacationwork). The objective of this work was to correct problems had by Gregor George in his 2007 thesis(“A <strong>Control</strong> <strong><strong>an</strong>d</strong> Measurement <strong>System</strong> <strong>for</strong> <strong>an</strong> <strong>Elevation</strong> <strong>over</strong> <strong>Azimuth</strong> Antenna Pedestal” [8]), themost signific<strong>an</strong>t being the interfacing with the synchros. On completion of the work Prof. Inggsproposed this thesis as the knowledge gained would be invaluable in completing this project.1.2 User SpecificationThe requirements of this project c<strong>an</strong> be divided into the high-level user requirements <strong><strong>an</strong>d</strong> the moretechnical functional requirements. The user requirements specify the <strong>over</strong>all product to be produced,while the functional requirements give specifications relating to the way in which the system mustfunction.3
1. INTRODUCTION1.2.1 User RequirementsThe requirements <strong>for</strong> this project are to produce hardware <strong><strong>an</strong>d</strong> <strong>an</strong> Application Program Interface(<strong>API</strong>) containing a collection of methods to allow effective control of the pedestal from a PC aswell as allowing access to import<strong>an</strong>t data such as the current <strong>an</strong>gular position. The movement of thepedestal must be as accurate as possible while still giving the best possible response. The <strong>API</strong> mustbe made <strong>for</strong> use in <strong>an</strong> open source environment.1.2.2 Functional RequirementsThe functional requirements of the system were split into the following 2 sections:<strong>Control</strong> CircuitryThe control circuitry built <strong>for</strong> the pedestal must be able to:1. Receive a digital input from the computer.2. Use this data to control the speed <strong><strong>an</strong>d</strong> direction of the 28V motors.3. Limit the movement of the pedestal on the elevation axis when the limit switch is activated.4. Allow the elevation axis to move in the other direction out of the limited position.5. Operate off a single 28V supply.Application Program InterfaceThe <strong>API</strong> programmed <strong>for</strong> the pedestal must contain:1. A public initialisation method to set up the 76CS1 Card <strong><strong>an</strong>d</strong> the data port used to connect tothe control hardware.2. Private methods to retrieve position <strong><strong>an</strong>d</strong> speed in<strong>for</strong>mation from the synchros <strong>for</strong> each axis.3. Private methods to control the movement of the pedestal by outputting the relev<strong>an</strong>t data tocontrol hardware.4. Public methods to read in<strong>for</strong>mation about the position <strong><strong>an</strong>d</strong> speed of the pedestal on each of itsaxes.5. A public method to move the pedestal to a specific position with the best possible accuracy<strong><strong>an</strong>d</strong> the fastest response.4
1. INTRODUCTION6. A public method to make the pedestal sc<strong>an</strong> a specific <strong>an</strong>gle r<strong>an</strong>ge stopping at predefined intervals.7. A public method to abort the current movement of the pedestal <strong><strong>an</strong>d</strong> stop its movement.1.3 Project ScopeFigure 1.3 shows the proposed system. Due to time constraints, only the control system <strong><strong>an</strong>d</strong> the <strong>API</strong>were chosen <strong>for</strong> this project. The modules of the system which fall outside of this project scope areshown in red while those included in the project are shown in green.This project does not include the modelling of the tr<strong>an</strong>sfer function <strong>for</strong> the pedestal <strong><strong>an</strong>d</strong> thus doesnot use control methods to design a controller algorithm. An ad-hoc approach was used that reliedon a robust software controller coupled with statistical data obtained from experimentation to give avery accurate <strong><strong>an</strong>d</strong> fast response.5
1. INTRODUCTIONFigure 1.3: Proposed system showing scope of project1.4 Requirements AnalysisFrom the user <strong><strong>an</strong>d</strong> functional requirements, the following observations c<strong>an</strong> be made:• Both the Parallel Port <strong><strong>an</strong>d</strong> the Universal Serial Bus (USB) are available to interface the computerwith the control hardware.6
1. INTRODUCTION• A Digital to Analogue Converter (DAC) must be built to ch<strong>an</strong>ge the digital signal from thecomputer port to <strong>an</strong> <strong>an</strong>alogue voltage.• The control circuitry must use this voltage to control the speed of the motor.• Speed c<strong>an</strong> be controlled by using Pulse Width Modulation (PWM) or variable voltage.• The input to the control hardware must also be able to ch<strong>an</strong>ge the direction of each motor.• The direction of each motor c<strong>an</strong> be ch<strong>an</strong>ged by using <strong>an</strong> H-Bridge.• A suitable logic circuit must be implemented to allow the single Limit Switch to be used inboth directions on the elevation axis.• The synchros must be interfaced with the computer through the 76CS1 card.• A suitable Linux distribution must be chosen in which to implement the <strong>API</strong>.• Suitable drivers must be found to install the 76CS1 Card in Linux.• Experiments must be conducted to determine the accuracy of the control system as well as theuncertainty in the measurements.1.5 Dissertation OverviewCHAPTER 2 gives <strong>an</strong> <strong>over</strong>view of certain hardware on the pedestal, the 76CS1 PCI Synchro toDigital Card <strong><strong>an</strong>d</strong> the structure of the junction box used to connect the synchros to the 76CS1. Someproblems involving the use of the synchros on the pedestal are shown <strong><strong>an</strong>d</strong> solutions proposed.CHAPTER 3 contains the design <strong><strong>an</strong>d</strong> unit testing of the hardware <strong>for</strong> the control system. Twoalmost identical circuits were designed <strong>for</strong> the elevation <strong><strong>an</strong>d</strong> azimuth axes respectively. They bothreceive inputs from the Parallel Port <strong><strong>an</strong>d</strong> interpret these using a Digital to Analog Converter (DAC),this DAC output then sets the reference input of <strong>an</strong> operational amplifier Pulse Width Modulation(PWM) generating circuit. This PWM signal is used to control the speed of <strong>an</strong> LMD18200T H-Bridge Integrated Circuit (IC) which facilitates the bi-directional control of the motors. The elevationaxis had the addition of a logic circuit to solve the problem of a single Limit Switch operating onboth extremes of the axis. A 5V voltage regulator IC was used to provide a 5V supply <strong>for</strong> the PWMcircuit <strong><strong>an</strong>d</strong> a 60mm f<strong>an</strong>. To ensure that every circuit would work, each module of the design wasbuilt <strong><strong>an</strong>d</strong> tested individually <strong><strong>an</strong>d</strong> then integrated into the bigger system. In order to simulate theParallel Port input, a simple circuit was built using a 5V supply <strong><strong>an</strong>d</strong> 8 toggle switches which wouldsend the appropriate high <strong><strong>an</strong>d</strong> low signals to the input of the DAC. This showed inadequacies insome approaches, especially in the use of the L298 Dual H-Bridge Driver IC.7
1. INTRODUCTIONCHAPTER 4 starts with the implementation of the hardware designed in Chapter 3 on a PrintedCircuit Board (PCB). The hardware was then integrated with the pedestal <strong><strong>an</strong>d</strong> connected to the computer.Functional testing was per<strong>for</strong>med to ensure that the total system functioned as predicted. Thenaming convention used <strong>for</strong> the different azimuth <strong><strong>an</strong>d</strong> elevation speeds is explained here.CHAPTER 5 contains five experiments to which were used to help in the design of a softwarecontroller <strong><strong>an</strong>d</strong> also to qu<strong>an</strong>tify the error in the azimuth axis synchro readings due to backlash.• Experiment 1: To determine the average <strong>over</strong>shoot <strong>for</strong> each azimuth axis speed <strong>over</strong> the full360 ◦ r<strong>an</strong>ge of movement.• Experiment 2: To determine the average <strong>over</strong>shoot <strong>for</strong> each elevation axis speed <strong>over</strong> the full60 ◦ r<strong>an</strong>ge of movement.• Experiment 3: To determine the average <strong>over</strong>shoot <strong>for</strong> each Software Pulse Width Modulatedvariation of the minimum azimuth axis speed <strong>over</strong> the full 360 ◦ r<strong>an</strong>ge of movement.• Experiment 4: To determine the average <strong>over</strong>shoot <strong>for</strong> each Software Pulse Width Modulatedvariation of the minimum elevation axis speed <strong>over</strong> the full 60 ◦ r<strong>an</strong>ge of movement.• Experiment 5: To approximate a value <strong>for</strong> the backlash in the gearing on the azimuth axis.CHAPTER 6 shows the ch<strong>an</strong>ges that were made to the 76CS1 drivers in order to have them compileon Ubuntu 8.04.1 with kernel version 2.6.24-21. It then gives a brief <strong>over</strong>view of how the thresholdswere calculated <strong>for</strong> each speed. Two flow charts depicting the coarse motor speed control algorithm<strong><strong>an</strong>d</strong> the fine motor speed control algorithm are shown. A description of all the structures, variables<strong><strong>an</strong>d</strong> methods in the pedestal <strong>API</strong> is given.CHAPTER 7 contains a number accept<strong>an</strong>ce tests to evaluate whether the final system satisfies theuser specification given in Chapter 1. A test to determine the positioning accuracy <strong>for</strong> each axis wasalso conducted. The accuracies were calculated to be:• The azimuth axis had <strong>an</strong> average accuracy of 0.1023 ◦ with a st<strong><strong>an</strong>d</strong>ard deviation of 0.0544 ◦ .• The elevation axis had <strong>an</strong> average accuracy of 0.0193 ◦ with a st<strong><strong>an</strong>d</strong>ard deviation of 0.0308 ◦ .CHAPTER 7 <strong>an</strong>alyses the results of Chapter 7 as well as other the functional test results fromChapter 4.8
1. INTRODUCTIONCHAPTER 8 draws appropriate conclusions from the testing conducted thoughout the project cycle.The following conclusions were made:1. The accuracy of the movement on the azimuth axis was calculated to be 0.1023 ◦ with a st<strong><strong>an</strong>d</strong>arddeviation of 0.0544 ◦ . This measure could be improved by increasing the number ofmeasurements taken.2. The accuracy of the movement on the elevation axis was calculated to be 0.0193 ◦ with ast<strong><strong>an</strong>d</strong>ard deviation of 0.0308 ◦ . This measure could be improved by increasing the number ofmeasurements taken.3. The backlash in the azimuth gearing was approximated to be 0.1892 ◦ . This gave <strong>an</strong> uncertaintyin the synchro reading of 0.1892 ◦ . Thus the total accuracy of the azimuth axis positioning wascalculated to be 0.2915 ◦ with a st<strong><strong>an</strong>d</strong>ard deviation of 0.0544 ◦ .4. This approximation <strong>for</strong> backlash was not very accurate as a lot of opportunities were availablein the testing to introduce hum<strong>an</strong> error into the measurement.5. The use of a non real-time Operating <strong>System</strong> <strong>for</strong> the <strong>API</strong> contributed to the error in the movementsas real-time measurements could not always be obtained.6. The controller implemented only used the current position of the pedestal to control the speedof movement. Thresholds were also defined according to experimental data which only relatedto the exact pedestal configuration used. If the weight of the <strong>an</strong>tenna is ch<strong>an</strong>ged, the dynamicsof the system will be altered <strong><strong>an</strong>d</strong> the controller thresholds would be invalid.7. The maximum speed of movement <strong>for</strong> the azimuth axis was not realised due to the azimuthcontrol hardware not being able to output a 100% duty cycle due to the 3.7V Parallel Portinputs.8. There are m<strong>an</strong>y non-linearities in the movement of each axis due to the wear of the gearingsystems. Without conducting appropriate tests <strong><strong>an</strong>d</strong> deriving a control tr<strong>an</strong>sfer function,the dynamics of the system c<strong>an</strong>not be predicted <strong><strong>an</strong>d</strong> a controller with the maximum possibleaccuracy <strong><strong>an</strong>d</strong> minimum response time c<strong>an</strong>not be constructed.9. The <strong>over</strong>shoot <strong>for</strong> each speed was averaged <strong>over</strong> both directions, this posed a problem <strong>for</strong> theelevation axis as the weight of the <strong>an</strong>tenna ch<strong>an</strong>ges the <strong>over</strong>shoot depending on the currentposition. Thus the results <strong>for</strong> each direction were very different <strong><strong>an</strong>d</strong> averaging them gave thebest solution <strong>for</strong> the controller designed in this project, but limited the response of the systembecause undershoot <strong><strong>an</strong>d</strong> <strong>over</strong>shoot occurred often <strong><strong>an</strong>d</strong> the fine motor control method had torec<strong>over</strong> from this error.9
1. INTRODUCTIONCHAPTER 9 gives recommendations to increase the functionality of the system. These recommendationscorrespond directly to increasing the accuracy <strong><strong>an</strong>d</strong> response of the system. The followingrecommendations were made <strong>for</strong> future work:1. Use commercial backlash measuring equipment <strong><strong>an</strong>d</strong> procedures to obtain a very accurate measurement<strong>for</strong> the backlash in the gearing systems.2. Use a real-time Operating <strong>System</strong> like RTLinux to allow <strong>for</strong> process priorities <strong><strong>an</strong>d</strong> schedulingalgorithms <strong>for</strong> the system to be set. This will ensure the system receives real-time measurementsfrom the synchros <strong><strong>an</strong>d</strong> c<strong>an</strong> per<strong>for</strong>m very accurate control.3. Increase the resolution (number of bits) of each DAC. This will enable the system to run atmore speeds <strong><strong>an</strong>d</strong> thus give better control. A separate Parallel Port <strong>for</strong> the elevation <strong><strong>an</strong>d</strong> azimuthaxes would be best.4. Use a driver circuit to ensure that the logic HIGH voltage from the Parallel Port enters theDAC as a 5V signal.5. Model the movement of the axes using control theory to obtain a tr<strong>an</strong>sfer function <strong>for</strong> thepedestal. This will allow <strong>for</strong> a controller which uses both speed <strong><strong>an</strong>d</strong> position to control themovement of the axes.10
Chapter 2Description of Existing HardwareThis chapter describes the already existing hardware that was used in this project. The synchros,Limit Switch <strong><strong>an</strong>d</strong> mech<strong>an</strong>ical gearing all relate to the tracking pedestal whereas the 76CS1 Digitalto Synchro Measurement card was a PCI card used in the computer to interpret the synchro outputs.2.1 SynchrosSynchos have been used as part of electromech<strong>an</strong>ical shaft <strong>an</strong>gle positioning <strong><strong>an</strong>d</strong> measurement systems<strong>for</strong> <strong>over</strong> 50 years with very good reliability <strong><strong>an</strong>d</strong> cost effectiveness [9]. A synchro is a namegiven to a family of instruments which function as rotating tr<strong>an</strong>s<strong>for</strong>mers. These devices take in oneor more time varying voltages <strong><strong>an</strong>d</strong> output <strong>an</strong>other set of voltages whose phase <strong><strong>an</strong>d</strong> magnitude areused to determine the <strong>an</strong>gular position of the shaft [10]. As the shaft of the synchro is turned, the <strong>an</strong>gularposition of its rotor winding in relation to its stator windings is represented by the AC voltagecoupled from the primary winding to the secondary windings (rotor to stator in a <strong>Control</strong> Tr<strong>an</strong>smitter<strong><strong>an</strong>d</strong> stator to rotor in a <strong>Control</strong> Tr<strong>an</strong>s<strong>for</strong>mer) [11].2.1.1 <strong>Control</strong> Synchros<strong>Control</strong> synchros are used in servo systems to provide <strong><strong>an</strong>d</strong> deal with control signals where accurate<strong>an</strong>gular tr<strong>an</strong>smission to a mech<strong>an</strong>ical load is required. <strong>Control</strong> synchros only function as passivepositioning or measurement devices <strong><strong>an</strong>d</strong> do not h<strong><strong>an</strong>d</strong>le <strong>an</strong>y motive power <strong>for</strong> driving the load [10].11
2. DESCRIPTION OF EXISTING HARDWAREFigure 2.1: Internal structure of a synchro control tr<strong>an</strong>smitter <strong><strong>an</strong>d</strong> its electrical representation (takenfrom [1])As shown in Figure 2.1, there are three stator windings which are connected in a star fashion 120°apart. These three windings are then brought directly to the output terminals S1, S2 <strong><strong>an</strong>d</strong> S3. Therotor is <strong>an</strong> extension of the shaft <strong><strong>an</strong>d</strong> its winding is usually connected via slip rings <strong><strong>an</strong>d</strong> brushes tothe terminals R1 <strong><strong>an</strong>d</strong> R2 [10].This arr<strong>an</strong>gement <strong>for</strong>ms a rotary tr<strong>an</strong>s<strong>for</strong>mer which if excited with <strong>an</strong> AC voltage (normally 60 Hzor 400 Hz) on the rotor, will induce corresponding voltages on the 3 S terminals corresponding tothe <strong>an</strong>gular position of the rotor [10].If the rotor of a synchro tr<strong>an</strong>smitter is excited by applying a reference voltage across terminals R1<strong><strong>an</strong>d</strong> R2 of the <strong>for</strong>m [10]:V re f = AsinωtThe voltages which will appear across the stator terminals will be [10]:V S1−S3 = Asinωt sinθV S3−S2 = Asinωt sin(θ + 120 ◦ )V S2−S1 = Asinωt sin(θ + 240 ◦ )12
2. DESCRIPTION OF EXISTING HARDWAREFigure 2.2: Synchro output voltages as shaft rotates at 3 RPM (taken from [1])From Figure 2.2 it c<strong>an</strong> be seen that the amplitude of the output voltage on the stator terminalscorresponds to the amplitude of <strong>an</strong> envelope sinusoid (sinθ, sin(θ +120 ◦ ) & sin(θ +120 ◦ )) that theoutput voltages follow when the shaft is rotated.2.1.2 Types of <strong>Control</strong> SynchrosThe two most common types of control synchro are the <strong>Control</strong> Tr<strong>an</strong>smitter (CX) <strong><strong>an</strong>d</strong> the <strong>Control</strong>Tr<strong>an</strong>s<strong>for</strong>mer (CT) [10].<strong>Control</strong> Tr<strong>an</strong>smitterThe rotor terminals of a CX are exited with <strong>an</strong> AC voltage <strong><strong>an</strong>d</strong> a corresponding voltage is inducedon the stator terminals [10].<strong>Control</strong> Tr<strong>an</strong>s<strong>for</strong>merA CT differs from a CX in that its stator terminals are excited with AC voltages. These voltagesdiffer in phase by 120° <strong><strong>an</strong>d</strong> correspond to the required <strong>an</strong>gular position of the shaft. An error signal13
2. DESCRIPTION OF EXISTING HARDWAREis induced on the rotor terminals to signal that the position of the shaft does not match the AC voltageinputs on the stator terminals. As the shaft is turned, the error signal ch<strong>an</strong>ges until a null voltage ispresent when the position of the shaft exactly matches the AC input voltages on the stator terminals[10].2.1.3 Synchros on the PedestalThe tracking pedestal uses 2 synchros, one on the azimuth axis <strong><strong>an</strong>d</strong> one on the elevation axis. Thesesynchros are <strong>Control</strong> Tr<strong>an</strong>s<strong>for</strong>mers, which are usually used to receive a positioning signal from a CX<strong><strong>an</strong>d</strong> tr<strong>an</strong>smit <strong>an</strong> error signal to a control system corresponding to the difference between the shaftposition <strong><strong>an</strong>d</strong> the required position. The 76CS1 card owned by UCT only has ch<strong>an</strong>nels which c<strong>an</strong>read in a signal from a CX.This me<strong>an</strong>s that the CT’s on the pedestal must be run backwards to essentially make CX’s. Thisworks in the same way as a regular CX, except that the reference voltage must be carefully chosenbecause the voltage on the R terminals is now stepped up to make the voltage on the S terminals(instead of stepped down in a regular CX). Thus <strong>for</strong> <strong>an</strong> output of 11.8Vrms as required by the 76CS1[5], the reference voltage must be set at approximately 3.6V.The ideal reference voltage c<strong>an</strong> be checked by measuring the Vrms across S1 <strong><strong>an</strong>d</strong> S3 <strong><strong>an</strong>d</strong> turningthe rotor until a maximum voltage is seen. This maximum voltage must be as close to, withoutexceeding, 11.8Vrms.2.2 The 76CS1 Synchro to Digital CardThe 76CS1 is a PCI Synchro/Resolver Measurement <strong><strong>an</strong>d</strong> Simulation Board <strong><strong>an</strong>d</strong> has 8 S/D (Synchroto Digital) <strong><strong>an</strong>d</strong> 6 D/S (Digital to Synchro) ch<strong>an</strong>nels [5]. The S/D ch<strong>an</strong>nels read in the 3 stator voltages(S1, S2 <strong><strong>an</strong>d</strong> S3) as well as the reference voltage used (R1 <strong><strong>an</strong>d</strong> R2) <strong><strong>an</strong>d</strong> allow a user to displaythe <strong>an</strong>gular position of a synchro. The D/S ch<strong>an</strong>nels output 3 stator voltages (S1, S2 <strong><strong>an</strong>d</strong> S3) <strong><strong>an</strong>d</strong>read in the <strong>an</strong>gular error (R1 <strong><strong>an</strong>d</strong> R2).The part number of the 76CS1 card acquired by UCT is:76CS1-040CSA-01The part number indicates the following configuration:14
2. DESCRIPTION OF EXISTING HARDWARE76CS1–04 4 ch<strong>an</strong>nels of S/D0 (0 D/S ch<strong>an</strong>nels) Synchro <strong>for</strong>matCSACommercial Temp environmentSynchro <strong>for</strong>mat (all ch<strong>an</strong>nels)Programmable reference supply (0-28 Vrms, 360 - 10 kHz)-01 Low voltage SYNCHRO input (11.8 Vrms signal input, 26.0 Vrms Reference input /Calibrated <strong><strong>an</strong>d</strong> tested @ 400 Hz) [12]Thus only 4 S/D ch<strong>an</strong>nels are available <strong><strong>an</strong>d</strong> require <strong>an</strong> ideal 11.8 Vrms signal input <strong><strong>an</strong>d</strong> at most a 26Vrms reference input2.2.1 Connecting Synchros to the 76CS1The card uses a 78-pin D connector to interface with synchros. Table 2.1 shows the pin configurationof the 78-pin D connector in order to connect synchros to the 76CS1 card.Ch. 1 S/D Ch. 2 S/D Ch. 3 S/D Ch. 4 S/DS1 39 18 36 15S2 58 76 55 73S3 78 57 75 54S4 19 37 16 34RHi 38 17 35 14RLo 77 56 74 53Table 2.1: 76CS1 Pin Configuration <strong>for</strong> S/D Ch<strong>an</strong>nels [5]• RHi output on pin 21• RLo output on pin 60The reference signal that feeds the synchro must also feed back to the card RHi <strong><strong>an</strong>d</strong> RLo inputs <strong>for</strong>the specific ch<strong>an</strong>nel, even if the 76CS1 card supplied the RHi <strong><strong>an</strong>d</strong> RLo signals. If this is not donethere will be a phase lock problem. This would cause unstable measurements <strong><strong>an</strong>d</strong> r<strong><strong>an</strong>d</strong>om 180 ◦ shiftsin the <strong>an</strong>gle measurement [12].15
2. DESCRIPTION OF EXISTING HARDWARE2.3 The <strong>Elevation</strong> Axis limit switchThere is a single limit on the elevation axis which is used to limit the movement in both directions.Two metal arms are mounted on the axis of rotation 60 ◦ apart. When the axis moves to either sideof the 60 ◦ boundary, one of the metal arms presses a switch mounted nearby. Figure 2.3 shows howthis is implemented.Figure 2.3: Limit switch implementation2.4 Mech<strong>an</strong>ical GearingThe tracking pedestal uses gears in specific ratios to allow the motors to turn the pedestal on its axes<strong><strong>an</strong>d</strong> to ensure that one rotation of the pedestal on the azimuth axis corresponds to one rotation of thesynchro monitoring the axis. A problem with this is that the physical coupling between two gearscauses degradation. This degradation leads to a problem referred to as Backlash.BacklashThe Americ<strong>an</strong> Meteorological Society (AMS) defines backlash as the play or loose motion in <strong>an</strong> instrumentdue to the clear<strong>an</strong>ce existing between mech<strong>an</strong>ically contacting parts [13]. In the pedestal’sgearing system, this applies to the gap between the teeth of two contacting gears. This gap will causea lag time from when the motor begins to spin, the pedestal begins to rotate <strong><strong>an</strong>d</strong> the synchro readingbegins to register this movement. The synchro could also settle at a different position to that of thepedestal axis, this error in position is equal to the gap between the contacting teeth of the gears. Inorder to get a measure of the accuracy of the pedestal movements, the backlash in the gearing of theazimuth axis must be measured. No backlash measurements need to be done <strong>for</strong> the elevation axis16
2. DESCRIPTION OF EXISTING HARDWAREas the synchro is coupled directly to the elevation axis of rotation <strong><strong>an</strong>d</strong> no gearing is used to connectthe two.17
Chapter 3Hardware Design <strong><strong>an</strong>d</strong> Unit TestingThis chapter describes the design <strong><strong>an</strong>d</strong> unit testing aspects of the control hardware. It c<strong>over</strong>s thedetails <strong><strong>an</strong>d</strong> testing of• the computer to control hardware interface;• the control hardware; <strong><strong>an</strong>d</strong>• the motor control.3.1 Unit Testing“The primary goal of unit testing is to take the smallest piece of testable softwarein the application, isolate it from the remainder of the code, <strong><strong>an</strong>d</strong> determine whether itbehaves exactly as you expect. Each unit is tested separately be<strong>for</strong>e integrating theminto modules to test the interfaces between modules. Unit testing has proven its valuein that a large percentage of defects are identified during its use.” Microsoft DeveloperNetwork [14]This software testing methodology was adapted <strong><strong>an</strong>d</strong> applied to the testing of the individual hardwareunits in the system. These units were designed, constructed <strong><strong>an</strong>d</strong> tested <strong><strong>an</strong>d</strong> only when all the unitswere complete were they integrated with eachother.3.2 Interface Between the Computer <strong><strong>an</strong>d</strong> the <strong>Control</strong> HardwareTwo computer ports were available to communicate with the control hardware:• The Universal Serial Bus (USB); <strong><strong>an</strong>d</strong>18
3. HARDWARE DESIGN AND UNIT TESTING• The Parallel PortThe Parallel Port was chosen as the interface between the computer <strong><strong>an</strong>d</strong> the control hardware. Thiswas due to its eight available bits to tr<strong>an</strong>sfer data <strong><strong>an</strong>d</strong> the ease in which it c<strong>an</strong> be accessed fromsoftware.3.3 Simulating the Parallel PortIn order to allow <strong>for</strong> testing of the hardware during the design stage, it was necessary to simulate theParallel Port output. A simple circuit was constructed using a 5V supply <strong><strong>an</strong>d</strong> eight toggle switchesto simulate the different output signals from the Parallel Port. Light Emitting Diodes (LED) wereadded to the design to give a visual representation of the output. The circuit diagram of the ParallelPort simulator is shown in Figure 3.1.Figure 3.1: Parallel Port simulation circuit3.4 Interpreting the Computer OutputThe 8-bit signal from the Parallel Port was divided into two sets of 4-bit signals. Each signal controllingthe motor on one of the axes. The three Least Signific<strong>an</strong>t Bits (LSB) in each 4-bit signal wouldcontrol the speed of the motor <strong><strong>an</strong>d</strong> the Most Signific<strong>an</strong>t Bit (MSB) would determine the direction ofthe motor. This is illustrated in Figure 3.2.19
3. HARDWARE DESIGN AND UNIT TESTINGFigure 3.2: Parallel Port output to DAC inputIn order to use each of the 3-bit speed inputs, two 3-bit Digital to Analogue Converters (DAC)were constructed. Off the shelf DAC Integrated Circuits (IC) were available but only with a greaternumber of inputs (i.e. more bits). A simple R-2R resistor configuration was used <strong>for</strong> each DAC <strong><strong>an</strong>d</strong>c<strong>an</strong> be seen in Figure 3.3. Each of the inputs to the elevation axis DAC was controlled through <strong>an</strong>AND gate with a STOP input. This STOP input will come from the limit switch logic circuit <strong><strong>an</strong>d</strong>facilitates the limiting of the elevation axis movement. When the STOP input was set to 0V all DACinputs were then set to 0V.Figure 3.3: DAC circuit diagram3.4.1 DAC Unit TestThe inputs in Table 3.1 were simulated using the Parallel Port simulator described in Section 3.3.20
3. HARDWARE DESIGN AND UNIT TESTING<strong>Elevation</strong> Axis (STOP = 111) <strong>Azimuth</strong> AxisBinary Input Output (V) Output (V)000 0.05 0.047001 0.54 0.62010 1.16 1.145011 1.45 1.744100 2.205 2.173101 2.52 2.775110 3.18 3.33111 3.5 3.93Table 3.1: Simulated DAC inputs <strong><strong>an</strong>d</strong> corresponding outputsWith STOP = 000, the output voltage <strong>for</strong> the elevation axis DAC was 0.047V <strong>for</strong> all binary inputs.3.5 <strong>Control</strong>ling the speed of the motorsTwo methods <strong>for</strong> controlling the speed of the motors were investigated:• Variable voltage; <strong><strong>an</strong>d</strong>• Pulse Width Modulation (PWM)3.5.1 Variable Voltage <strong>Control</strong>lerThe variable voltage controller was designed <strong><strong>an</strong>d</strong> constructed using a LM358 single supply operationalamplifier (op-amp) <strong><strong>an</strong>d</strong> a TIP122 Darlington tr<strong>an</strong>sistor to source the current as shown inFigure 3.4. This gave a 0-28V output <strong>for</strong> the corresponding 0-5V input from the DAC. A problemwith this approach is that power is wasted because the circuit steps down the 28V supply voltage tothe specified output <strong><strong>an</strong>d</strong> the voltage not applied to the motor is dissipated as heat.Figure 3.4: Variable voltage controller21
3. HARDWARE DESIGN AND UNIT TESTING3.5.2 PWM <strong>Control</strong>lerA PWM controller produces a chopped output to the motor of maximum voltage (28V) <strong><strong>an</strong>d</strong> variesthe duty cycle of its output in order to vary the speed. This method uses power very efficiently as thefull supply voltage is only used during every pulse which gives <strong>an</strong> average voltage output relating tothe duty cycle of the PWM <strong>Control</strong>ler. Thus the voltage is stepped down by essentially turning thesupply voltage on <strong><strong>an</strong>d</strong> off <strong><strong>an</strong>d</strong> power is not wasted. For this reason, PWM was chosen as the methodto control the motor speed. The PWM circuit was constructed using four op-amps (a single LM324quad op-amp [15]), a single tr<strong>an</strong>sistor (2N2222 [16]), resistors <strong><strong>an</strong>d</strong> capacitors (adapted from [2]).The circuit diagram c<strong>an</strong> be seen in Figure 3.5.Figure 3.5: PWM circuit [2]• Op-amps 1 <strong><strong>an</strong>d</strong> 3 act as a Schmitt Trigger <strong><strong>an</strong>d</strong> Miller Integrator <strong><strong>an</strong>d</strong> produce a saw-toothwave<strong>for</strong>m [2].• Op-amp 3 acts as a low gain amplifier <strong><strong>an</strong>d</strong> moves the bottom of the wave<strong>for</strong>m to just above0V.• Op-amp 4 functions as a comparator <strong><strong>an</strong>d</strong> compares the wave<strong>for</strong>m outputted by op-amp 3 tothe PWM <strong>Control</strong>ler input voltage. If the wave<strong>for</strong>m voltage is greater th<strong>an</strong> the input voltage,the output of op-amp 4 is high, otherwise the output is low. This effectively outputs a squarewave with a duty cycle that varies according to the PWM <strong>Control</strong>ler input voltage.• This output drives a tr<strong>an</strong>sistor with a pull-up resistor which inverts the square wave<strong>for</strong>m fromop-amp 4 <strong><strong>an</strong>d</strong> moves the peak of the wave<strong>for</strong>m to 5V <strong><strong>an</strong>d</strong> the trough to 0V to ensure each stateis recognised as a logic HIGH <strong><strong>an</strong>d</strong> LOW voltage respectively.22
3. HARDWARE DESIGN AND UNIT TESTINGFigure 3.6: Visual representation of how the PWM controller works [2]3.5.3 Software PWMIf the smallest speed obtained from the PWM controller is not low enough to facilitate accuratepositioning of each axis, a method of further reducing the duty cycle of the motor output will beneeded. Software Pulse Width Modulation c<strong>an</strong> be used to achieve this.Software PWM involves modulating the output of the Parallel Port with varying duty cycles. TheParallel Port is set to the lowest speed output <strong>for</strong> a certain amount of time then set to 000 <strong>for</strong> <strong>an</strong>otherperiod of time. The time that the port is set to the lowest speed in relation to the time that it is setto 000 determines the duty cycle of the outputted signal. This duty cycle from the Parallel Port willcombine with the duty cycle of the PWM <strong>Control</strong>ler to output a voltage to the motor with a dutycycle equal to the product of the two duty cycles. Figure 3.7 demonstrates the combining of the dutycycles.3.5.4 PWM Unit TestTable 3.2 shows how the duty cycle of the output to the motor ch<strong>an</strong>ges as the input to the PWMcontroller is varied. The inputs correspond to the outputs generated in Section 3.4.1.23
3. HARDWARE DESIGN AND UNIT TESTINGFigure 3.7: Combined duty cycle output<strong>Azimuth</strong> AxisPWM Input (V) Output +ve Duty Cycle (%)0.05 00.54 321.16 43.51.45 58.92.205 69.92.52 85.23.18 1003.5 100<strong>Elevation</strong> Axis (STOP = 111)PWM Input (V) Output +ve Duty Cycle (%)0.047 00.62 01.145 49.81.744 56.32.173 74.52.775 82.23.33 1003.93 100Table 3.2: PWM circuit inputs <strong><strong>an</strong>d</strong> corresponding outputsWith STOP = 000, the output +ve duty cycle from the elevation axis PWM <strong>Control</strong>ler was 0% <strong>for</strong>all voltage inputs.3.6 Bi-directional Motor <strong>Control</strong>In order to facilitate bi-directional control of the motors, a method was needed to reverse the directionof the current flow through each motor. This c<strong>an</strong> be achieved using <strong>an</strong> H-Bridge circuit. It is possibleto build <strong>an</strong> H-Bridge circuit using discrete components. However, it is easier to use off the shelf IC’swhich do not require sophisticated timing circuitry to prevent a short circuit. Short circuits c<strong>an</strong> occurin H-Bridges if two in-line tr<strong>an</strong>sistors are on at the same time. Figure 3.8 shows a basic H-Bridgecircuit.24
3. HARDWARE DESIGN AND UNIT TESTINGFigure 3.8: Basic H-Bridge circuitTr<strong>an</strong>sistors 1 <strong><strong>an</strong>d</strong> 4 are turned on <strong>for</strong> current flow in one direction (tr<strong>an</strong>sistors 2 <strong><strong>an</strong>d</strong> 3 are off) <strong><strong>an</strong>d</strong>tr<strong>an</strong>sistors 2 <strong><strong>an</strong>d</strong> 3 are turned on <strong>for</strong> current flow in the opposite direction (tr<strong>an</strong>sistors 1 <strong><strong>an</strong>d</strong> 4 areoff). If either tr<strong>an</strong>sistors 1 <strong><strong>an</strong>d</strong> 3 or 2 <strong><strong>an</strong>d</strong> 4 are on at the same time, a short circuit will occur (calledshoot through current). In addition to protective logic to ensure that two in-line tr<strong>an</strong>sistors are notturned on at the same time, a timing circuit is needed to ensure that sufficient time is given <strong>for</strong> oneset of tr<strong>an</strong>sistors to turn off be<strong>for</strong>e the other set is turned on. For this reason two H-Bridge IC’s wereinvestigated:• The L298 Dual H-Bridge; <strong><strong>an</strong>d</strong>• The LMD18200T H-Bridge.3.6.1 L298 Dual H-Bridge ICThe L298 is a high voltage, high current dual H-Bridge IC. It accepts st<strong><strong>an</strong>d</strong>ard Tr<strong>an</strong>sistor-Tr<strong>an</strong>sistorLogic (TTL) voltage levels <strong><strong>an</strong>d</strong> also has <strong>an</strong> additional supply input to allow <strong>for</strong> lower voltage logicsignals. Two enable inputs are available which enable or disable the device independently of theother input signals. The emitters of the lower tr<strong>an</strong>sistors of each bridge are connected together <strong><strong>an</strong>d</strong>c<strong>an</strong> be connected to ground or used <strong>for</strong> the connection of <strong>an</strong> external current sensing resistor. TheL298 is designed to drive inductive loads such as DC motors, stepping motors, relays <strong><strong>an</strong>d</strong> solenoids[3].25
3. HARDWARE DESIGN AND UNIT TESTINGFigure 3.9: L298 block diagram [3]• The In1, In2 <strong><strong>an</strong>d</strong> In3, In4 inputs were used to control the direction of the first <strong><strong>an</strong>d</strong> secondH-Bridges respectively.• The EnA <strong><strong>an</strong>d</strong> EnB lines were each connected to <strong>an</strong> output of one of the two PWM generatingcircuits.• The Vss input is used as a reference <strong>for</strong> the AND gates in order to function <strong>for</strong> both TTL <strong><strong>an</strong>d</strong>lower voltage logic signals <strong><strong>an</strong>d</strong> was connected to 5V.• The SENSE A <strong><strong>an</strong>d</strong> SENSE B pins were connected to ground as no monitoring or regulation ofthe motor current was needed.• Protection diodes were placed from each motor output to ground <strong><strong>an</strong>d</strong> the supply in order todissipate the back-emf generated by the turning motor.L298 Unit TestThis unit test consisted of setting the PWM duty cycle <strong><strong>an</strong>d</strong> monitoring the motor output lines with <strong>an</strong>oscilloscope to see the wave<strong>for</strong>m generated. The motors were connected <strong><strong>an</strong>d</strong> the speed observed. Atlow speeds the motor exhibited inconsistent movement <strong><strong>an</strong>d</strong> when monitored with the oscilloscope avariation in the duty cycle of the wave<strong>for</strong>m on the motor leads was seen. The wave<strong>for</strong>m also had<strong>an</strong> irregularly long fall time in relation to its frequency. At a low frequency of 125 Hz (8ms period)26
3. HARDWARE DESIGN AND UNIT TESTINGa fall time of 1.5ms was observed. The 1.5ms fall time persisted when the frequency of the PWMcircuit was increased, this there<strong>for</strong>e would not allow the frequency to be increased <strong>an</strong>y further asthe pulse would not reach its trough be<strong>for</strong>e the leading edge of the next pulse. This slow fall timewas thought to be due to the internal logic switching time or the protection diode rec<strong>over</strong>y time.The switching time of the internal logic could not be ch<strong>an</strong>ged <strong>for</strong> obvious reasons. The diodes werereplaced with faster Shottky diodes however no improvement was seen. For these reasons, it wasdecided to use a different H-Bridge IC.3.6.2 LMD18200 H-BridgeThe LMD18200 is a 3A single H-Bridge IC <strong><strong>an</strong>d</strong> is designed <strong>for</strong> motion control applications. Itincludes a PWM input to control speed, a Brake input which connects the output terminals together,a Current Sense output which allows <strong>for</strong> the connection of <strong>an</strong> external current sensing resistor <strong><strong>an</strong>d</strong> aThermal Flag output which is raised when the IC exceeds a certain temperature <strong><strong>an</strong>d</strong> shuts down. Thedevice is built using a multi-technology process which combines bipolar <strong><strong>an</strong>d</strong> Complementary MetalOxide Semiconductor (CMOS) control circuitry with Double-diffused Metal Oxide Semiconductor(DMOS) power devices on a single IC [4].Figure 3.10: LMD18200 block diagram [4]• The DIRECTION input was used to control the direction of the H-Bridge.• The BRAKE input was not used <strong><strong>an</strong>d</strong> was connected to GND.• The PWM input was connected to the output of the PWM generating circuit.• The CURRENT SENSE OUTPUT was not needed <strong><strong>an</strong>d</strong> was connected to GND.27
3. HARDWARE DESIGN AND UNIT TESTING• The THERMAL FLAG OUTPUT was left unconnected.• A 10nF capacitor was placed from BOOTSTRAP 1 to OUTPUT 1 <strong><strong>an</strong>d</strong> from BOOTSTRAP 2 toOUTPUT 2. This allows the MOSFET’s to switch at frequencies above 1kHz [4] (up to 500kHz[17]).LMD18200 Unit TestThe method <strong>for</strong> this unit test was identical to that <strong>for</strong> the L298. However, the LMD18200 gave astable, const<strong>an</strong>t square wave output to the motor with a duty cycle matching that of the PWM signal.3.7 Limit Switch LogicAs discussed in Section 2.3, a single Limit Switch exists on the elevation axis. A suitable logiccircuit was required to ensure that only a single direction of motion is allowed at each limit. RSFlip Flops were needed <strong>for</strong> the system to “remember” which direction triggered the Limit Switch toensure that ch<strong>an</strong>ging the direction while in a limited position does get interpreted as a limit condition<strong>for</strong> the other direction. Table 3.3 shows a state chart <strong>for</strong> the required logic circuit, where:• X0 <strong><strong>an</strong>d</strong> X1 are RS Flip Flops• Lim is 1 when the Limit Switch is pressed <strong><strong>an</strong>d</strong> 0 otherwise.• Dir is the direction input <strong>for</strong> the controller• STOP will go directly to the STOP input <strong>for</strong> the elevation axis DAC.Present State Input Next State OutputX0 X1 Dir Lim X0 X1 STOP0 0 0 0 0 0 10 0 0 1 1 0 00 0 1 0 0 0 10 0 1 1 0 1 00 1 0 0 0 0 10 1 0 1 0 1 10 1 1 0 0 0 10 1 1 1 0 1 01 1 0 0 0 0 11 1 0 1 1 0 01 1 1 0 0 0 11 1 1 1 1 0 1Table 3.3: State chart <strong>for</strong> limit switch logic circuit28
3. HARDWARE DESIGN AND UNIT TESTINGFrom Table 3.3 the following relationships were defined:X0 = Dir.Lim.X1X1 = Dir.Lim.X0X0 reset = LimX1 reset = LimSTOP = Dir.X0 + Dir.X1 + LimFrom these relationships, the circuit depicted by the circuit diagram in Figure 3.11 was built.Figure 3.11: Limit switch logic circuit3.7.1 Logic Circuit Unit TestThe inputs (Dir <strong><strong>an</strong>d</strong> Lim) were varied to match each of the cases in the State Chart. The intermediatestates <strong>for</strong> X0 <strong><strong>an</strong>d</strong> X1 as well as the output (STOP) matched the predicted values.3.8 Voltage RegulatorThe PWM generator <strong><strong>an</strong>d</strong> the Limit Switch logic circuit both need a 5V supply to operate. To satisfythis requirement whilst still running the system off a single 28V supply, a 5V voltage regulator wasneeded. A 7805 5V voltage regulator IC was chosen due to it ready availability. Because the input29
3. HARDWARE DESIGN AND UNIT TESTINGvoltage of 28V was near to the rated absolute maximum of 35V <strong>for</strong> the IC [18] <strong><strong>an</strong>d</strong> the output voltagewas low, a heat sink was needed. A SK104 heat sink was used <strong><strong>an</strong>d</strong> a layer of silicon heat tr<strong>an</strong>sfercompound was added between the IC <strong><strong>an</strong>d</strong> heat sink <strong>for</strong> good heat tr<strong>an</strong>sfer. Figure 3.12 shows thecircuit diagram <strong>for</strong> the voltage regulator.Figure 3.12: Voltage regulator circuit diagram3.9 76CS1 Junction BoxIt is time consuming <strong><strong>an</strong>d</strong> difficult to connect <strong><strong>an</strong>d</strong> disconnect wires from the 78 pin D connector onthe 76CS1 card every time a synchro on the pedestal is added or removed. That is why a junctionbox was built to facilitate the easy addition to <strong><strong>an</strong>d</strong> removal from the S/D ch<strong>an</strong>nels.The junction box has a perm<strong>an</strong>ent connection to the 78 pin D connector to connect to the 76CS1 card<strong><strong>an</strong>d</strong> four 5-pin DIN connectors through which the synchros c<strong>an</strong> be connected. The internal wiringof the box is also done in such a way to facilitate the feedback of the reference signal from the cardso that the user only has to deal with connecting the five terminals of the synchro. The top <strong><strong>an</strong>d</strong> sideviews of the junction box are shown in Figure 3.13 <strong><strong>an</strong>d</strong> Figure 3.14 respectively.Figure 3.13: Top view of junction box showing internal wiring30
3. HARDWARE DESIGN AND UNIT TESTINGFigure 3.14: Side view of junction box showing p<strong>an</strong>el mounted DIN sockets31
Chapter 4Hardware Implementation <strong><strong>an</strong>d</strong> FunctionalTestingThis chapter c<strong>over</strong>s the implementation of the circuits designed in Chapter 3 as Printed CircuitBoards (PCB) as well as the functional testing of the control circuit as a whole to ensure that itmatches the results from Chapter 3.4.1 PCB ImplementationThe implementation of the two PCB’s involved selecting components, drawing the circuit <strong>for</strong> thetotal system in EAGLE Layout Editor <strong><strong>an</strong>d</strong> routing the tracks <strong>for</strong> the boards. The Limit Switchlogic circuit was implemented on a separate PCB which was then mounted on top of the main PCB.Sections 4.1.1 <strong><strong>an</strong>d</strong> 4.1.2 give the circuit diagram <strong><strong>an</strong>d</strong> PCB layout <strong>for</strong> the main PCB <strong><strong>an</strong>d</strong> the limitswitch logic PCB respectively. The accomp<strong>an</strong>ying CD contains a detailed bill of materials used <strong>for</strong>each PCB to allow <strong>for</strong> these boards to be recreated.4.1.1 <strong>Control</strong> Circuit PCBThe board made <strong>for</strong> the control circuit had to contain two nearly identical circuits, one <strong>for</strong> each axis.Extra 5V-GND pins were added to allow the connection of a 5V f<strong>an</strong> or <strong>an</strong>y other circuit. Figure4.1 shows the schematic <strong>for</strong> the control circuit <strong><strong>an</strong>d</strong> Figure 4.2 shows the PCB layout <strong><strong>an</strong>d</strong> the routedtracks.32
4. HARDWARE IMPLEMENTATION AND FUNCTIONAL TESTINGFigure 4.1: <strong>Control</strong> circuit schematic33
4. HARDWARE IMPLEMENTATION AND FUNCTIONAL TESTINGFigure 4.2: Routed PCB of control circuit34
4. HARDWARE IMPLEMENTATION AND FUNCTIONAL TESTING4.1.2 Limit Switch Logic PCBThe Limit Switch logic circuit was constructed on a separate PCB due to its routing complexity <strong><strong>an</strong>d</strong>to save space by mounting it above the control circuit PCB. Figure 4.4 gives the schematic of thecircuit <strong><strong>an</strong>d</strong> Figure 4.3 shows the PCB layout <strong><strong>an</strong>d</strong> routed tracks. Due to the lack of components likeresistors on the board which allow <strong>for</strong> easy routing, jumpers were needed to connect certain tracks.These jumpered tracks were limited to 5V <strong><strong>an</strong>d</strong> ground lines in order to ensure that <strong>an</strong>y connectionproblems would not interfere with the logic signals. R1, R2, JP1, JP2, JP3, JP4, JP5 <strong><strong>an</strong>d</strong> JP6 wereused as jumpers. The 5V <strong><strong>an</strong>d</strong> GND tracks on the schematic were connected by specifying thatthey connect to the same network. Thus some pins or wires on the schematic may appear to beunconnected.Figure 4.3: Routed PCB of logic circuit35
4. HARDWARE IMPLEMENTATION AND FUNCTIONAL TESTINGFigure 4.4: Limit Switch logic circuit schematic36
4. HARDWARE IMPLEMENTATION AND FUNCTIONAL TESTINGFor the remainder of this document, a naming convention is used <strong>for</strong> the speeds which correspondsto the decimal value of the binary number outputted to the Parallel Port to obtain that speed. In thecase of the SPWM speeds, the speed which is being reduced is shown first followed by the a numbercorresponding to the the SPWM speed in relation to the other SPWM speeds (where 3 is the fastest<strong><strong>an</strong>d</strong> 1 the slowest).For example:• A DAC input of 101 on the azimuth axis is called Speed 5.• The slowest SPWM of speed 010 on the azimuth axis is called Speed 2.1.• A DAC input of 101 on the elevation axis is called Speed 80.• The slowest SPWM of speed 010 on the elevation axis is called Speed 32.14.2 Functional TestingA functional test on a system concerns only the inputs <strong><strong>an</strong>d</strong> the outputs of the total system. It is oftenreferred to as Black Box testing as the internal functioning of the system is unseen. It is used to verifywhether a system gives the correct output <strong>for</strong> a specific input [19]. If the outputs are unexpected, theseparate modules of the system c<strong>an</strong> be investigated to determine the problem. Table 4.1 shows theParallel Port inputs to the system <strong><strong>an</strong>d</strong> the pulse width modulated outputs to the motors. The X’s inthe control hardware inputs indicate that the value of that bit is negligible in this test. These bits arethe direction bits <strong><strong>an</strong>d</strong> do not affect the output duty cycle to the motors.37
4. HARDWARE IMPLEMENTATION AND FUNCTIONAL TESTING<strong>Control</strong> Hardware Input <strong>Elevation</strong> Axis Motor +ve Duty Cycle (%) <strong>Azimuth</strong> Axis Motor +ve Duty Cycle (%)X000X000 0 0X001X001 0 0X010X010 50 37.1X011X011 57.1 44.7X100X100 74.8 51.9X101X101 83.1 62.8X110X110 100 72.7X111X111 100 82.7Table 4.1: Functional test inputs <strong><strong>an</strong>d</strong> outputs38
Chapter 5ExperimentationA number of experiments were conducted to obtain results to aid in the design <strong><strong>an</strong>d</strong> tuning of thecontrol software. The experiment to determine the backlash in the gearing of the azimuth axis gavea measure of the accuracy of the <strong>an</strong>gular in<strong>for</strong>mation received from the azimuth axis synchro.5.1 Experiment 15.1.1 AimTo determine the average <strong>over</strong>shoot <strong>for</strong> each azimuth axis speed <strong>over</strong> the full 360 ◦ r<strong>an</strong>ge of movement.5.1.2 MethodA test program was written that moved the pedestal on the azimuth axis at a predefined speed.At each degree on the axis, it recorded the position where it turned off the motor, then waited 2seconds. It then recorded the position where it had settled, moved back 20 ◦ <strong><strong>an</strong>d</strong> moved to the nexttest point on the axis (1 ◦ further th<strong>an</strong> the previous point). This program was run <strong>for</strong> each speed inboth the clockwise (CW) <strong><strong>an</strong>d</strong> <strong>an</strong>ti-clockwise (CCW) directions. The <strong>over</strong>shoot at each point c<strong>an</strong> becalculated by subtracting the position where the motor was turned off from the position where thepedestal settled on the azimuth axis.5.1.3 ResultsWith 360 measurements recorded per test, 2 directions <strong><strong>an</strong>d</strong> 6 speeds, a total of 4320 measurementswere taken. The full results are contained on the accomp<strong>an</strong>ying CD. Table 5.1 shows a summary ofthe results.39
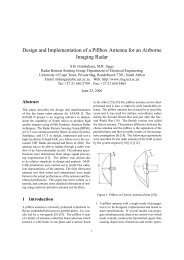
5. EXPERIMENTATIONSpeed Direction Min. Overshoot ( ◦ ) Max. Overshoot ( ◦ ) Me<strong>an</strong> ( ◦ ) Vari<strong>an</strong>ce ( ◦2 ) St<strong><strong>an</strong>d</strong>ard Deviation ( ◦ )2 CCW 0.3021 0.4450 0.3767 0.0007 0.02692 CW 0.2802 0.4339 0.3609 0.0009 0.03082 Both 0.2802 0.4450 0.3688 0.0009 0.02993 CCW 0.3845 0.5220 0.4520 0.0006 0.02453 CW 0.3730 0.5110 0.4414 0.0007 0.02643 Both 0.3730 0.5220 0.4467 0.0007 0.02604 CCW 0.4560 0.6040 0.5238 0.0007 0.02594 CW 0.4180 0.5713 0.5089 0.0007 0.02684 Both 0.4180 0.6040 0.5164 0.0007 0.02745 CCW 0.5550 0.7250 0.6411 0.0006 0.02465 CW 0.5550 0.6922 0.6254 0.0006 0.02495 Both 0.5550 0.7250 0.6332 0.0007 0.02596 CCW 0.6920 0.8080 0.7509 0.0006 0.02446 CW 0.6710 0.7910 0.7333 0.0006 0.02406 Both 0.6710 0.8080 0.7421 0.0007 0.02577 CCW 0.7910 0.9390 0.8647 0.0008 0.02867 CW 0.7306 0.9290 0.8469 0.0010 0.03097 Both 0.7306 0.9390 0.8558 0.0010 0.0311Table 5.1: Results <strong>for</strong> Experiment 1Figure 5.1 shows the St<strong><strong>an</strong>d</strong>ard Normal Distribution Probability Density Function (PDF) <strong>for</strong> eachspeed.The values <strong>for</strong> the Normal Distribution PDF were calculated using [20]:40
5. EXPERIMENTATIONf (x) = 1σ √ 2π e−(x−µ)2 /2σ 2 (5.1)where σ is the st<strong><strong>an</strong>d</strong>ard deviation, µ is the me<strong>an</strong> <strong><strong>an</strong>d</strong> x is the <strong>over</strong>shoot value.These values were then normalised to a St<strong><strong>an</strong>d</strong>ard Normal Distribution with σ = 0 <strong><strong>an</strong>d</strong> µ = 0. Thisgave the following equation [20]:n(z) = 1 √2πe −z2 /2(5.2)wherez = x − µσ(5.3)If n(z) vs. z was plotted on the same axis <strong>for</strong> each speed, all the plots would be centered on 0 <strong><strong>an</strong>d</strong> <strong>an</strong>idea of the magnitude of the <strong>over</strong>shoot value <strong>for</strong> each speed would not be given. Thus a plot of n(z)vs. x was done where z was calculated using Equation 5.3.Figure 5.1: St<strong><strong>an</strong>d</strong>ard Normal Distribution PDF of results <strong>for</strong> Experiment 141
5. EXPERIMENTATION5.1.4 ConclusionsThe results from this experiment were used to create thresholds around the target position at whichthe speed must be reduced to ensure <strong>over</strong>shoot does not occur. The <strong>over</strong>shoot <strong>for</strong> the minimumspeed was averaged as 0.3688 ◦ . This me<strong>an</strong>t that the motor must be turned off at 0.3688 ◦ be<strong>for</strong>e thetarget position in order to stop within ±0.1196 ◦ (±4×σ) from the target position 97.7% of the time[21]. This ±0.1196 ◦ r<strong>an</strong>ge was too large <strong><strong>an</strong>d</strong> needed to be improved upon. For this reason, SoftwarePWM was implemented in order to reduce the speed further.5.2 Experiment 25.2.1 AimTo determine the average <strong>over</strong>shoot <strong>for</strong> each elevation axis speed <strong>over</strong> the full 60 ◦ r<strong>an</strong>ge of movement.5.2.2 MethodA test program was written that moved the pedestal on the elevation axis at a predefined speedstarting from 0 ◦ . At each degree on the axis, it recorded the position where it turned off the motor,then waited 2 seconds. It then recorded the position where it had settled, moved back 5 ◦ <strong><strong>an</strong>d</strong> movedto the next test point on the axis (1 ◦ further th<strong>an</strong> the previous point). This program was run <strong>for</strong>each speed in both the clockwise <strong><strong>an</strong>d</strong> <strong>an</strong>ti-clockwise directions. Speed 112 was not measured as itsduty cycle was the same as Speed 96 (100%) <strong><strong>an</strong>d</strong> would have produced the same results. Due to thelimitations in the movement of the pedestal on the elevation axis (0 ◦ to 60 ◦ only), the tests in theclockwise direction r<strong>an</strong> from 5 ◦ to 60 ◦ <strong><strong>an</strong>d</strong> the tests in the <strong>an</strong>ti-clockwise direction r<strong>an</strong> from 0 ◦ to55 ◦ . The <strong>over</strong>shoot at each point c<strong>an</strong> be calculated by subtracting the position where the motor wasturned off from the position where the pedestal settled on the elevation axis.5.2.3 ResultsWith 56 measurements recorded per test <strong>for</strong> 5 speeds <strong><strong>an</strong>d</strong> 2 directions, a total of 560 measurementswere taken. The full results are contained on the accomp<strong>an</strong>ying CD. Table 5.2 shows the average<strong>over</strong>shoot <strong>for</strong> each speed in each direction.42
5. EXPERIMENTATIONSpeed Direction Min. Overshoot ( ◦ ) Max. Overshoot ( ◦ ) Me<strong>an</strong> ( ◦ ) Vari<strong>an</strong>ce ( ◦2 ) St<strong><strong>an</strong>d</strong>ard Deviation ( ◦ )32 CCW 1.4117 1.6973 1.5536 0.0022 0.047132 CW 1.8951 2.1533 1.9812 0.0021 0.045432 Both 1.4117 2.1533 1.7674 0.0483 0.219748 CCW 1.6260 2.0325 1.8619 0.0086 0.092648 CW 2.2083 2.5434 2.3891 0.0035 0.059348 Both 1.6260 2.5434 2.1255 0.0762 0.276064 CCW 2.5049 2.8290 2.6627 0.0039 0.062464 CW 2.9773 3.3014 3.1878 0.0047 0.068464 Both 2.5049 3.3014 2.9252 0.0739 0.271880 CCW 2.9498 3.2795 3.1371 0.0042 0.064580 CW 3.5046 3.8836 3.7013 0.0067 0.081980 Both 2.9498 3.8836 3.4192 0.0857 0.292896 CCW 3.7408 4.0155 3.8756 0.0034 0.058396 CW 4.3561 4.6582 4.5225 0.0035 0.058896 Both 3.7408 4.6582 4.1990 0.1091 0.3302Table 5.2: Results <strong>for</strong> Experiment 2Figure 5.2 shows the St<strong><strong>an</strong>d</strong>ard Normal Distribution Probability Density Function (PDF) <strong>for</strong> eachspeed. The values <strong>for</strong> n(z) were calculated in the same m<strong>an</strong>ner as Experiment 1.43
5. EXPERIMENTATION5.2.4 ConclusionsFigure 5.2: St<strong><strong>an</strong>d</strong>ard Normal Distribution PDF of results <strong>for</strong> Experiment 2The results from this experiment were used to create thresholds around the target position at whichthe speed must be reduced to ensure <strong>over</strong>shoot does not occur. The <strong>over</strong>shoot <strong>for</strong> the minimumspeed was averaged as 1.7674 ◦ . This me<strong>an</strong>t that the motor must be turned off at 1.7674 ◦ be<strong>for</strong>e thetarget position in order to stop within ±7.0696 ◦ (±4×σ) from the target position 97.7% of the time[21]. This ±7.0696 ◦ r<strong>an</strong>ge was too large <strong><strong>an</strong>d</strong> needed to be improved upon. For this reason, SoftwarePWM was implemented in order to reduce the speed further.5.3 Experiment 35.3.1 AimTo determine the average <strong>over</strong>shoot <strong>for</strong> each Software Pulse Width Modulated variation of the minimumazimuth axis speed <strong>over</strong> the full 360 ◦ r<strong>an</strong>ge of movement.5.3.2 MethodA test program was written that moved the pedestal on the azimuth axis at each of the SPWM speedsstarting from 0 ◦ . At each degree on the axis, it recorded the position where it turned off the motor,44
5. EXPERIMENTATIONthen waited 2 seconds. It then recorded the position where it had settled, moved back 5 ◦ <strong><strong>an</strong>d</strong> movedto the next test point on the axis (1 ◦ further th<strong>an</strong> the previous point). This program was run <strong>for</strong> eachSPWM speed in both the clockwise <strong><strong>an</strong>d</strong> <strong>an</strong>ti-clockwise directions. The <strong>over</strong>shoot at each point c<strong>an</strong>be calculated by subtracting the position where the motor was turned off from the position where thepedestal settled on the azimuth axis.45
5. EXPERIMENTATION5.3.3 ResultsSpeed Direction Min. Overshoot ( ◦ ) Max. Overshoot ( ◦ ) Me<strong>an</strong> ( ◦ ) Vari<strong>an</strong>ce ( ◦2 ) St<strong><strong>an</strong>d</strong>ard Deviation ( ◦ )2.1 CCW -0.0330 0.1870 0.0160 0.0006 0.02482.1 CW -0.0870 0.3190 0.0147 0.0017 0.04132.1 Both -0.0870 0.3190 0.0154 0.0012 0.03412.2 CCW -0.0280 0.1870 0.0182 0.0005 0.02162.2 CW -0.0550 0.3020 0.0202 0.0020 0.04502.2 Both -0.0550 0.3020 0.0192 0.0012 0.03532.3 CCW -0.0440 0.0990 0.0300 0.0009 0.02952.3 CW -0.0494 0.0880 0.0214 0.0008 0.02762.3 Both -0.0494 0.0990 0.0257 0.0008 0.0289Table 5.3: Results <strong>for</strong> Experiment 3Figure 5.3 shows the St<strong><strong>an</strong>d</strong>ard Normal Distribution Probability Density Function (PDF) <strong>for</strong> eachspeed. The values <strong>for</strong> n(z) were calculated in the same m<strong>an</strong>ner as Experiment 1.46
5. EXPERIMENTATION5.3.4 ConclusionsFigure 5.3: St<strong><strong>an</strong>d</strong>ard Normal Distribution PDF of results <strong>for</strong> Experiment 3The results from this experiment were used to create thresholds around the target position at whichthe speed must be reduced to ensure <strong>over</strong>shoot does not occur. The <strong>over</strong>shoot <strong>for</strong> the minimum speedwas averaged as 1.016 ◦ with a st<strong><strong>an</strong>d</strong>ard deviation of 0.0341 ◦ .5.4 Experiment 45.4.1 AimTo determine the average <strong>over</strong>shoot <strong>for</strong> each Software Pulse Width Modulated variation of the minimumelevation axis speed <strong>over</strong> the full 60 ◦ r<strong>an</strong>ge of movement.5.4.2 MethodA test program was written that moved the pedestal on the elevation axis at each of the SPWMspeeds starting from 0 ◦ . At each degree on the axis, it recorded the position where it turned off themotor, then waited 2 seconds. It then recorded the position where it had settled, moved back 2 ◦ <strong><strong>an</strong>d</strong>moved to the next test point on the axis (1 ◦ further th<strong>an</strong> the previous point). This program was run<strong>for</strong> each SPWM speed in both the clockwise <strong><strong>an</strong>d</strong> <strong>an</strong>ti-clockwise directions. Due to the limitationsin the movement of the pedestal on the elevation axis (0 ◦ to 60 ◦ only), the tests in the clockwise47
5. EXPERIMENTATIONdirection r<strong>an</strong> from 2 ◦ to 60 ◦ <strong><strong>an</strong>d</strong> the tests in the <strong>an</strong>ti-clockwise direction r<strong>an</strong> from 0 ◦ to 58 ◦ . The<strong>over</strong>shoot at each point c<strong>an</strong> be calculated by subtracting the position where the motor was turned offfrom the position where the pedestal settled on the elevation axis.48
5. EXPERIMENTATION5.4.3 ResultsSpeed Direction Min. Overshoot ( ◦ ) Max. Overshoot ( ◦ ) Me<strong>an</strong> ( ◦ ) Vari<strong>an</strong>ce ( ◦2 ) St<strong><strong>an</strong>d</strong>ard Deviation ( ◦ )32.1 CCW -0.0110 0.0165 0.0030 0.00004 0.006132.1 CW -0.0165 0.0824 0.0215 0.0004 0.019232.1 Both -0.0165 0.0824 0.0122 0.0003 0.017032.2 CCW -0.0110 0.0330 0.0073 0.0001 0.009932.2 CW -0.0055 0.1263 0.0536 0.0006 0.024232.2 Both -0.0110 0.1263 0.0304 0.0009 0.029732.3 CCW 0.0000 0.2087 0.0561 0.0017 0.041132.3 CW 0.0165 0.2198 0.1043 0.0016 0.040332.3 Both 0.0000 0.2198 0.0802 0.0022 0.0472Table 5.4: Results <strong>for</strong> Experiment 4Figure 5.4 shows the St<strong><strong>an</strong>d</strong>ard Normal Distribution Probability Density Function (PDF) <strong>for</strong> eachspeed. The values <strong>for</strong> n(z) were calculated in the same m<strong>an</strong>ner as Experiment 1.49
5. EXPERIMENTATIONFigure 5.4: St<strong><strong>an</strong>d</strong>ard Normal Distribution PDF of results <strong>for</strong> Experiment 45.4.4 ConclusionsThe results from this experiment were used to create thresholds around the target position at whichthe speed must be reduced to ensure <strong>over</strong>shoot does not occur. The <strong>over</strong>shoot <strong>for</strong> the minimum speedwas averaged as 0.0122 ◦ with a st<strong><strong>an</strong>d</strong>ard deviation of 0.017 ◦ . Due to the fact that the <strong>over</strong>shoot wasaveraged <strong>for</strong> both directions, <strong><strong>an</strong>d</strong> the <strong>an</strong>tenna weight caused large <strong>over</strong>shoots in the CW direction<strong><strong>an</strong>d</strong> small <strong>over</strong>shoots in the CCW direction, the PDF <strong>for</strong> each speed c<strong>over</strong>ed a very wide r<strong>an</strong>ge of<strong>an</strong>gles.5.5 Experiment 55.5.1 AimTo approximate a value <strong>for</strong> the backlash in the gearing on the azimuth axis.50
5. EXPERIMENTATION5.5.2 MethodA protractor was drawn using AutoCAD which had tick markings every 0.1 ◦ <strong><strong>an</strong>d</strong> <strong>an</strong> approximatedist<strong>an</strong>ce of 1mm between 0.1 ◦ markings at the circumference. The pedestal was placed at the centerof this protractor <strong><strong>an</strong>d</strong> a laser pointer was mounted on it. The pedestal was moved to 1 ◦ <strong><strong>an</strong>d</strong> the laseraligned with the 1 ◦ marking on the circumference of the pedestal. The pedestal was then moved tothe 10 ◦ , 20 ◦ , 30 ◦ , 40 ◦ , 50 ◦ , 60 ◦ , 70 ◦ , 80 ◦ , 90 ◦ positions while returning to 1 ◦ between movements.At every stationary position, the synchro reading was taken <strong><strong>an</strong>d</strong> the actual position was read on theprotractor. This test was per<strong>for</strong>med twice to get a larger set of results.5.5.3 ResultsThe full results <strong>for</strong> this experiment are contained on the accomp<strong>an</strong>ying CD. From the results, thevalue <strong>for</strong> backlash was calculated to be 0.0392 ◦ with a st<strong><strong>an</strong>d</strong>ard deviation of 0.0375 ◦ .5.5.4 ConclusionsThe value <strong>for</strong> backlash was calculated to be 0.0392 ◦ with a st<strong><strong>an</strong>d</strong>ard deviation of 0.0375 ◦ . Thisresult gives a r<strong>an</strong>ge of values in which the actual value <strong>for</strong> backlash c<strong>an</strong> be found. To ensure thatthe real value <strong>for</strong> backlash is accounted <strong>for</strong>, a value of 0.1892 ◦ will be used. This value is equal toµ + 4σ <strong><strong>an</strong>d</strong> will ensure that the value <strong>for</strong> backlash is less th<strong>an</strong> the approximated value, 97.7% of thetime [21]. This is to ensure that the value <strong>for</strong> the accuracy of the synchros on the azimuth axis is aworst case value <strong><strong>an</strong>d</strong> encompasses nearly all other possible values <strong>for</strong> the backlash.51
Chapter 6Software DesignIt was specified that the Pedestal <strong>Control</strong>ler system run in <strong>an</strong> open source environment. Althoughthe most common open source environment available <strong>for</strong> a PC is Linux, there are m<strong>an</strong>y distributionsor “flavours” available. Ubuntu 8.04 LTS - Hardy Heron was chosen <strong>for</strong> this project because of itsuser-friendliness <strong><strong>an</strong>d</strong> large user base at UCT. The kernel version used was 2.6.24-21. Programs werewritten using gedit in GNOME <strong><strong>an</strong>d</strong> were compiled using the Makefile utility <strong><strong>an</strong>d</strong> g++ version 4.2.4.6.1 Installing the 76CS1The Linux drivers supplied by North Atl<strong>an</strong>tic Industries <strong>for</strong> the 76CS1 card were compiled usingRed Hat Enterprise Linux 4.0 <strong>for</strong> a kernel version of 2.6.9. This posed a problem as a numberof comm<strong><strong>an</strong>d</strong>s <strong><strong>an</strong>d</strong> libraries had been depreciated in the newer kernels <strong><strong>an</strong>d</strong> consequently the kernelmodule, the driver program <strong><strong>an</strong>d</strong> test programs would not compile. Table 6.1 gives the ch<strong>an</strong>ges thatwere made in order to compile the necessary filesThe drivers were compiled <strong><strong>an</strong>d</strong> installed by following the instructions in the buildnotes.txt file thataccomp<strong>an</strong>ied them.Filename Line Number Phrase to replace New phraseMakefile 46 CFLAGS EXTRA_CFLAGSnai.c 175 SA_SHIRQ IRQF_SHARED” 22 ” 229 pci_module_init pci_register_driverTable 6.1: Ch<strong>an</strong>ges made to 76CS1 files52
6. SOFTWARE DESIGN6.2 Real-time programmingA real-time system is a computer system which requires that not only the results of <strong>an</strong> operation arecorrect, the results must also be produced within a specified time period [22]. Results returned afterthe time period has elapsed may be of no real value.6.2.1 Hard Real-TimeA hard real-time system has the most stringent time requirements. It guar<strong>an</strong>tees that critical realtimetasks will be completed within their deadlines [22]. In a hard real-time system, a late result isuseless.6.2.2 Soft Real-TimeA soft real-time system has less stringent timing requirements <strong><strong>an</strong>d</strong> a critical process will receivepriority <strong>over</strong> other tasks until it is complete [22]. No guar<strong>an</strong>tee is given that the deadline will be met.In soft real-time systems, a late result is less valuable but not useless.6.2.3 The Pedestal <strong>Control</strong>lerThe pedestal controller process needed to read in position in<strong>for</strong>mation as often as possible in orderto know the current position of each of the axes. This me<strong>an</strong>t that if the pedestal was moving <strong><strong>an</strong>d</strong> oneof the position read functions or the controller loop process was preempted by the operating system,a threshold could be missed causing the pedestal to <strong>over</strong>shoot its target position. For this reasonthe system needed to act as much like a hard real-time system as possible. This was very difficultusing the regular Linux kernel as process <strong><strong>an</strong>d</strong> thread priorities <strong><strong>an</strong>d</strong> scheduling techniques c<strong>an</strong>notbe specified by the programmer. Thus occasionally the OS would preempt the pedestal controllerprocess causing a threshold to be missed. Also if the terminal used to run the program lost focus, theOS would put the process to sleep <strong><strong>an</strong>d</strong> because the data on the Parallel Port is latched, the pedestalwould move at its current speed indefinitely. The “nice –15” comm<strong><strong>an</strong>d</strong> was used to execute theprogram <strong><strong>an</strong>d</strong> give the process the maximum priority of -15, however no improvement was noted.Another Linux kernel is available <strong>for</strong> installation which would allow the priority of each process <strong><strong>an</strong>d</strong>the scheduling technique to be controlled. This kernel is called RTLinux <strong><strong>an</strong>d</strong> is a Linux kernel suitedto real-time applications. Due to the time constraints of this project, the RTLinux kernel was notimplemented.53
6. SOFTWARE DESIGN6.3 Multithreaded ProgrammingA thread is flow of control within a process [22]. Threads allows multiple paths of control within asingle process. Multithreaded programming has a number of benefits which c<strong>an</strong> be categorised asfollows [22]:• Responsiveness - The interactivity of a process c<strong>an</strong> be maintained while a part of it is blockedor executing a length operation.• Resource Sharing - Threads share the memory <strong><strong>an</strong>d</strong> resources of the parent process to whichthey belong.• Economy - Because threads share memory <strong><strong>an</strong>d</strong> resources, it is more economical to create<strong><strong>an</strong>d</strong> context-switch between threads of the same process th<strong>an</strong> creating <strong><strong>an</strong>d</strong> context-switchingbetween two separate processes.• Utilisation of multiprocessor architectures - In multiprocessor architectures threads may berunning in parallel on different processor whereas a single process c<strong>an</strong> only run on one CPUregardless of how m<strong>an</strong>y are available.6.3.1 PThreadsThe PThread library provides <strong>an</strong> <strong>API</strong> <strong>for</strong> thread creation <strong><strong>an</strong>d</strong> synchronisation defined by the POSIXst<strong><strong>an</strong>d</strong>ard (IEEE 1003.1c) [22]. This library was used to create threads <strong>for</strong> methods that containedloops which would block the flow of the total process. This ensured that comm<strong><strong>an</strong>d</strong>s could still besent to the pedestal controller while it was busy moving the pedestal. The most import<strong>an</strong>t of thesecomm<strong><strong>an</strong>d</strong>s being the Abort comm<strong><strong>an</strong>d</strong> <strong><strong>an</strong>d</strong> comm<strong><strong>an</strong>d</strong>s to receive the current axis positions.6.4 <strong>Control</strong>ling the Movement of the PedestalTo ensure no <strong>over</strong>shoot occurs <strong><strong>an</strong>d</strong> no ch<strong>an</strong>ge of direction is needed to rec<strong>over</strong>, the speed of themovement when approaching the setpoint should be reduced accordingly. Thus in order to move thepedestal to a setpoint on either of its two axes, it is imperative that the speed of the movement isreduced or stopped be<strong>for</strong>e the position reaches a dist<strong>an</strong>ce equal to the threshold <strong>for</strong> the current speedaway from the setpoint. Figure 6.1 demonstrates this concept using <strong>an</strong> arbitrary threshold <strong>for</strong> eachspeed.54
6. SOFTWARE DESIGNFigure 6.1: Speed vs. Dist<strong>an</strong>ce to setpointWhere A to C are the threshold values <strong>for</strong> each of the SPWM speeds <strong><strong>an</strong>d</strong> D to I are the thresholdvalues <strong>for</strong> each regular PWM speed respectively.These thresholds were defined as the sum of the me<strong>an</strong> <strong>over</strong>shoot <strong>for</strong> the current speed <strong><strong>an</strong>d</strong> all theslower speeds <strong><strong>an</strong>d</strong> are given in Table 6.2.<strong>Azimuth</strong> AxisSpeed Threshold ( ◦ )2.1 0.01542.2 0.03462.3 0.06032 0.42903 0.87574 1.39215 2.02536 2.76747 3.6232<strong>Elevation</strong> AxisSpeed Threshold ( ◦ )32.1 0.012232.2 0.042732.3 0.122932 1.890348 4.015864 6.941080 10.360296 14.5592Table 6.2: Threshold value <strong>for</strong> each speed55
6. SOFTWARE DESIGN6.5 <strong>Control</strong> AlgorithmIn order to code the position control method <strong>for</strong> each axis, a suitable algorithm had to be designed.Figure 6.2 shows the flow chart <strong>for</strong> the control of the coarse (regular PWM) speeds.Figure 6.2: Flowchart of coarse speed control algorithmTo accurately position the pedestal on both of its axes, a method of fine motor control was needed.Software Pulse Width Modulation was used which allowed <strong>for</strong> each axis to move at very slow speeds.Figure 6.3 shows the flowchart <strong>for</strong> the control of the fine (Software PWM) speeds.56
6. SOFTWARE DESIGNFigure 6.3: Flowchart of fine speed control algorithmBoth the coarse <strong><strong>an</strong>d</strong> fine speed control methods const<strong>an</strong>tly check <strong>an</strong> integer called Abort. If Abort =0, regular functioning continues, but if Abort = 1, the method outputs a speed of 0 to the motor <strong><strong>an</strong>d</strong>ends. The algorithms shown in Figure 6.2 <strong><strong>an</strong>d</strong> Figure 6.3 apply to both the azimuth <strong><strong>an</strong>d</strong> elevationaxes. However on the elevation axis, the speed values will r<strong>an</strong>ge from 16 to 112 in increments of 16instead of from 2 to 7 in increments of 1.57
6. SOFTWARE DESIGN6.6 Description of CodeThis section describes the methods, structures <strong><strong>an</strong>d</strong> import<strong>an</strong>t variables contained in the pedestalcontrol <strong>API</strong>. Only the section names correspond to actual code. All the method descriptions usepseudo-code to describe their function.6.7 Structures6.7.1 struct PositionsThis structure contains two double values <strong><strong>an</strong>d</strong> is used to pass the theta <strong><strong>an</strong>d</strong> phi setpoints to theped_ThrMoveTo thread.6.8 VariablesThe following variables are used globally in the pedestal controller <strong><strong>an</strong>d</strong> should not be accessed fromoutside of the pedestal.cpp file.6.8.1 double AcoarseSpeeds[6]This array contains the thresholds <strong>for</strong> the regular PWM azimuth axis speeds obtained from the resultsof Experiment 1 in Section 5.1. AcoarseSpeeds[5] <strong><strong>an</strong>d</strong> AcoarseSpeeds[0] correspond to thethresholds <strong>for</strong> Speed 7 <strong><strong>an</strong>d</strong> Speed 2 respectively.6.8.2 double AfineSpeeds[3]This array contains the thresholds <strong>for</strong> the SPWM azimuth axis speeds obtained from the results ofExperiment 3 in Section 5.3. AfineSpeeds[2] <strong><strong>an</strong>d</strong> AfineSpeeds[0] correspond to the thresholds <strong>for</strong>Speed 2.3 <strong><strong>an</strong>d</strong> Speed 2.1 respectively.6.8.3 double EcoarseSpeeds[6]This array contains the thresholds <strong>for</strong> the regular PWM elevation axis speeds obtained from theresults of Experiment 2 in Section 5.2. AcoarseSpeeds[6] <strong><strong>an</strong>d</strong> AcoarseSpeeds[0] correspond to thethresholds <strong>for</strong> Speed 112 <strong><strong>an</strong>d</strong> Speed 32 respectively.58
6. SOFTWARE DESIGN6.8.4 double EfineSpeeds[3]This array contains the thresholds <strong>for</strong> the SPWM elevation axis speeds obtained from the results ofExperiment 4 in Section 5.4. EfineSpeeds[2] <strong><strong>an</strong>d</strong> EfineSpeeds[0] correspond to the thresholds <strong>for</strong>Speed 32.3 <strong><strong>an</strong>d</strong> Speed 32.1 respectively.6.8.5 int A_ch<strong>an</strong>, E_ch<strong>an</strong>A_ch<strong>an</strong> <strong><strong>an</strong>d</strong> E_ch<strong>an</strong> contain the ch<strong>an</strong>nel number <strong>for</strong> the 76CS1 of the synchro used on the azimuth<strong><strong>an</strong>d</strong> elevation axes respectively.6.8.6 double Theta, PhiTheta <strong><strong>an</strong>d</strong> Phi contain the current position of the pedestal on the azimuth <strong><strong>an</strong>d</strong> elevation axes respectively.6.9 Methods6.9.1 int ped_Initialise(int a_ch<strong>an</strong>, int e_ch<strong>an</strong>)This method opens the 76CS1 <strong><strong>an</strong>d</strong> gives it the following configuration:• Sets the ch<strong>an</strong>nels used <strong>for</strong> the elevation <strong><strong>an</strong>d</strong> azimuth axis synchros to e_ch<strong>an</strong> <strong><strong>an</strong>d</strong> a_ch<strong>an</strong>respectively• Sets the a_ch<strong>an</strong> <strong><strong>an</strong>d</strong> e_ch<strong>an</strong> ch<strong>an</strong>nels to Active;• Sets the a_ch<strong>an</strong> <strong><strong>an</strong>d</strong> e_ch<strong>an</strong> ch<strong>an</strong>nels to Synchro mode;• Sets the voltage of the output reference signal to 3.6V.The Parallel Port is also checked to determine whether the program c<strong>an</strong> access it. The return valuec<strong>an</strong> take three values, namely:1. The Parallel Port c<strong>an</strong> be accessed but the 76CS1 setup failed;2. The 76CS1 setup was successful but the Parallel Port c<strong>an</strong>not be accessed (most probably dueto lack of root privileges);3. The 76CS1 setup was successful <strong><strong>an</strong>d</strong> the Parallel Port c<strong>an</strong> be accessed.59
6. SOFTWARE DESIGN6.9.2 void* ped_Emoveto(void *arg)This method only uses pointers to void in its call. Arguments are cast to the appropriate type toaccess the in<strong>for</strong>mation, i.e. the set point is contained in arg. The coarse speed control loop depictedin Figure 6.2 is implemented in this method to control the elevation axis. Once the control loop hascompleted, the ped_Emovesmall method is called.6.9.3 void* ped_Emovesmall(void *arg)This method only uses pointers to void in its call. Arguments are cast to the appropriate type toaccess the in<strong>for</strong>mation, i.e. the set point is contained in arg. The fine speed control loop depicted inFigure 6.3 is implemented in this method to control the elevation axis.6.9.4 void* ped_Amoveto(void *arg)This method only uses pointers to void in its call. Arguments are cast to the appropriate type toaccess the in<strong>for</strong>mation, i.e. the set point is contained in arg. The coarse speed control loop depictedin Figure 6.2 is implemented in this method to control the azimuth axis. Once the control loop hascompleted, the ped_Amovesmall method is called.6.9.5 void* ped_Amovesmall(void *arg)This method only uses pointers to void in its call. Arguments are cast to the appropriate type toaccess the in<strong>for</strong>mation, i.e. the set point is contained in arg. The coarse speed control loop depictedin Figure 6.3 is implemented in this method to control the azimuth axis.6.9.6 int ped_GetTheta()This method returns the current position of the pedestal on the azimuth axis.6.9.7 int ped_GetPhi()This method returns the current position of the pedestal on the elevation axis.6.9.8 void ped_Abort()This method raises the Abort flag (equal to 1) which causes <strong>an</strong>y running movement thread to stopthe motors <strong><strong>an</strong>d</strong> terminate.60
6. SOFTWARE DESIGN6.9.9 int ped_MoveTo(double theta, double phi)This method creates a thread which executes the ped_ThrMoveTo method. It passes a void pointerto the thread which contains the setpoint <strong>for</strong> each axis wrapped in the Positions struct. The Movement_Completeflag is set to 0 to signal that a movement is in progress. The Abort flag is also set to 0to allow <strong>for</strong> the movement to be interrupted. The method then returns 1 to indicate that movement ofthe axes has begun. This is done to ensure that the control of the movement methods is not h<strong><strong>an</strong>d</strong>ledin the main process flow <strong><strong>an</strong>d</strong> is instead h<strong><strong>an</strong>d</strong>led in a separate thread.6.9.10 void* ped_ThrMoveTo(void *arg)This method uses the methods described in Sections 6.9.2, 6.9.3, 6.9.4, 6.9.5. It takes a void pointeras its argument which is then cast to a Positions struct to obtain the setpoints <strong>for</strong> the azimuth <strong><strong>an</strong>d</strong>elevation axes <strong><strong>an</strong>d</strong> follows the following execution pattern:1. Call ped_Amoveto(theta).2. Wait <strong>for</strong> ped_Amoveto to complete its execution.3. Call ped_Emoveto(phi).4. Wait <strong>for</strong> ped_Emoveto to complete its execution.5. Raise Movement_Complete flag (equal to 1).6.9.11 int ped_raster(double theta1, double phi1, double theta2, double phi2,double Ainc, double Einc)This method per<strong>for</strong>ms a Raster Sc<strong>an</strong> of the box created by the theta1, phi1, theta2, phi2 coordinates.The pedestal moves along the azimuth axis in increments defined by Ainc. After each increment,the Raster_Stop flag is raised (equal to 1). The method then sleeps until the flag is lowered. It thenmoves to the next increment on the azimuth axis. When the azimuth axis reaches the other limitdefined by the raster box, the elevation axis is incremented by Einc. This sequence continues untilthe opposite corner of the box is reached (theta2, phi2). Figure 6.4 shows this movement. TheRaster_Stop flag is used to ensure that <strong>an</strong> application using the <strong>API</strong> has time to receive data from <strong>an</strong><strong>an</strong>tenna on the pedestal at each increment.61
6. SOFTWARE DESIGNFigure 6.4: Raster Sc<strong>an</strong>62
Chapter 7<strong>System</strong> ValidationThis chapter per<strong>for</strong>ms a r<strong>an</strong>ge of tests to produce results which c<strong>an</strong> be used to validate the <strong>over</strong>allsystem in terms of the user specification.7.1 Accept<strong>an</strong>ce TestingAccording to the <strong>System</strong>s Engineering Guidebook <strong>for</strong> ITS [23], <strong>an</strong> Accept<strong>an</strong>ce Test is a <strong>for</strong>maltesting conducted to determine whether or not a system satisfies its accept<strong>an</strong>ce criteria. In the contextof this project, the accept<strong>an</strong>ce criteria correspond directly to the user specification <strong>for</strong> the system.Multiple tests were conducted to determine whether the system satisfied the accept<strong>an</strong>ce criteria.These tests beg<strong>an</strong> with the system in a specific state, <strong>an</strong> input was applied <strong><strong>an</strong>d</strong> the resulting outputobserved. A Pass/Fail assessment was given <strong>for</strong> every test.7.1.1 Test 1This test focuses on the ped_Initialise method <strong><strong>an</strong>d</strong> tests its various outputs.Case 1• State:– Program run with root privileges.– 76CS1 not open.• Input:– ped_Initialise(1,2)63
7. SYSTEM VALIDATION• Output:– Synchro ch<strong>an</strong>nel 1 assigned to azimuth axis.– Synchro ch<strong>an</strong>nel 2 assigned to elevation axis.– 76CS1 reference voltage set to 3,6V.– 3 is returned.• Pass/Fail– PASSCase 2• State:– Program run without root privileges.– 76CS1 not open.• Input:– ped_Initialise(1,2)• Output:– Synchro ch<strong>an</strong>nel 1 assigned to azimuth axis.– Synchro ch<strong>an</strong>nel 2 assigned to elevation axis.– 76CS1 reference voltage set to 3,6V.– Parallel port c<strong>an</strong>not be accessed.– 2 is returned.• Pass/Fail– PASS64
7. SYSTEM VALIDATIONCase 3• State:– Program run with root privileges.– 76CS1 device not installed.• Input:– ped_Initialise(1,2)• Output:– 76CS1 c<strong>an</strong>not be opened.– 1 is returned.• Pass/Fail– PASS7.1.2 Test 2This test focuses on the ped_MoveTo <strong><strong>an</strong>d</strong> tests a few variations of its inputs.Case 1• State:– Pedestal is stationary in <strong>an</strong>y position.• Input:– ped_MoveTo(40,55)• Output:– Pedestal moves to 40 ◦ on the azimuth axis.– Pedestal moves to 55 ◦ on the elevation axis.– Movement_Complete flag = 1.• Pass/Fail– PASS65
7. SYSTEM VALIDATIONCase 2• State:– Pedestal is at 90 ◦ on the azimuth axis.– Pedestal is at 0 ◦ on the elevation axis.• Input:– ped_MoveTo(90,60)• Output:– Pedestal does not move on the azimuth axis.– Pedestal moves to 60 ◦ on the elevation axis.– Movement_Complete flag = 1.• Pass/Fail– PASSCase 3• State:– Pedestal is at 120 ◦ on the azimuth axis.– Pedestal is at 40 ◦ on the elevation axis.• Input:– ped_MoveTo(0,0)• Output:– Pedestal moves past 0 ◦ , does a full revolution <strong><strong>an</strong>d</strong> stops at 0 ◦ the second time.– Pedestal moves to 0 on the elevation axis.– Movement_Complete flag = 1.• Pass/Fail– FAIL66
7. SYSTEM VALIDATION7.1.3 Test 3This test focuses on the ped_GetTheta <strong><strong>an</strong>d</strong> ped_GetPhi methods.Case 1• State:– Pedestal is stationary• Input:– ped_GetTheta()• Output:– Current position of the azimuth axis is returned.• Pass/Fail– PASSCase 2• State:– Pedestal is stationary.• Input:– ped_GetPhi()• Output:– Current position of the elevation axis is returned.• Pass/Fail– PASS67
7. SYSTEM VALIDATIONCase 3• State:– Pedestal is moving to a position.• Input:– ped_GetTheta()– ped_GetPhi()• Output:– Current position of the azimuth axis is returned from ped_GetTheta call.– Current position of elevation axis is returned from ped_GetPhi call.• Pass/Fail– PASS7.1.4 Test 4This test focuses on the ped_raster method.Case 1• State:– Pedestal is stationary• Input:– ped_raster(0,0,100,60,10,10)• Output:– Pedestal moves to 0 ◦ on the azimuth axis.– Pedestal moves to 0 ◦ on the elevation axis.– Pedestal moves the specified 100 ◦ azimuth r<strong>an</strong>ge in 10 ◦ increments.– The elevation axis is moved to 10 ◦ .– Pedestal moves the specified 100 ◦ azimuth r<strong>an</strong>ge in −10 ◦ increments.68
7. SYSTEM VALIDATION– The elevation axis is moved to 20 ◦ .– This continues until the pedestal reaches a position of 100 ◦ on the azimuth axis <strong><strong>an</strong>d</strong> 60 ◦on the elevation axis.• Pass/Fail– PASS7.1.5 Test 5This test focuses on the ped_Abort comm<strong><strong>an</strong>d</strong>.Case 1• State:– Pedestal is moving to a position.• Input:– ped_Abort()• Output:– Current movement stops <strong><strong>an</strong>d</strong> ped_ThrMoveTo terminates.• Pass/Fail– PASSCase 2• State:– Pedestal is per<strong>for</strong>ming a raster sc<strong>an</strong>.• Input:– ped_Abort()• Output:– Current movement stops <strong><strong>an</strong>d</strong> ped_raster terminates.• Pass/Fail– PASS69
7. SYSTEM VALIDATION7.2 Determining the Accuracy of the <strong>System</strong>To qu<strong>an</strong>tify a result <strong>for</strong> the accuracy of the system, a test program was written which moved thepedestal to a number of positions on both the azimuth <strong><strong>an</strong>d</strong> elevation axes. The final position <strong><strong>an</strong>d</strong>the setpoint were recorded to determine the error in each movement. The full results are containedon the accomp<strong>an</strong>ying CD. The results were <strong>an</strong>alysed <strong><strong>an</strong>d</strong> the following measure of accuracy wasdetermined:• The azimuth axis had <strong>an</strong> average accuracy of 0.1023 ◦ with a st<strong><strong>an</strong>d</strong>ard deviation of 0.0544 ◦ .• The elevation axis had <strong>an</strong> average accuracy of 0.0193 ◦ with a st<strong><strong>an</strong>d</strong>ard deviation of 0.0308 ◦ .70
Chapter 8Analysis of ResultsThis chapter <strong>an</strong>alyses the results obtained in the functional testing of the hardware <strong><strong>an</strong>d</strong> the systemvalidation tests of Chapter 7. The validity of these results as well as the reason <strong>for</strong> <strong>an</strong>y deviationfrom the expected results is also discussed.8.1 Functional Testing of HardwareThe functional test results obtained in Section 4.2 summarised the functionality of the control hardware.The duty cycle outputs <strong>for</strong> the corresponding inputs to the azimuth axis DAC did not matchthe results obtained during the unit testing. Upon further investigation, it was found that the ParallelPort voltage used at the DAC inputs was in fact 3.7V <strong><strong>an</strong>d</strong> not the simulated 5V. This caused alower voltage to be outputted by the DAC <strong><strong>an</strong>d</strong> thus a lower duty cycle was obtained from the PWM<strong>Control</strong>ler. However, the duty cycle outputs <strong>for</strong> the corresponding inputs to the elevation axis DACdid match the results obtained in the unit testing. This is because, the AND gates used at the DACinputs output a const<strong>an</strong>t voltage <strong><strong>an</strong>d</strong> thus as long as the DAC inputs are reliably recognised as a logicHIGH or LOW, the AND gate outputs will be the same voltage.8.2 Accept<strong>an</strong>ce TestingThe PASS/FAIL assessment <strong>for</strong> each of the accept<strong>an</strong>ce tests allows <strong>for</strong> a measure of how well thesystem satisfies its user specification. All the tests were assessed as a PASS except Test 2 Case 3.This test is a special case of the regular ped_MoveTo method. It demonstrates how the use of a nonreal-time system c<strong>an</strong> cause the irregular functioning of a device or program that requires a real-timesystem. The reason that the set point was missed in the first revolution, was due to the fact that theprogram could not access the <strong>an</strong>gle in<strong>for</strong>mation from the card <strong><strong>an</strong>d</strong> thus missed the r<strong>an</strong>ge in whichit must stop. This was most probably due to the OS assigning <strong>an</strong>other task a higher priority which71
8. ANALYSIS OF RESULTSpreempted the pedestal controller when it was passing through this r<strong>an</strong>ge.8.3 Determining the Accuracy of the <strong>System</strong>The accuracy of the system was qu<strong>an</strong>tified, although due to the statistical nature of the data on whichthe controller was designed, this accuracy took the <strong>for</strong>m of a statistical r<strong>an</strong>ge. 70 measurement wereused to define this r<strong>an</strong>ge on the elevation axis <strong><strong>an</strong>d</strong> 200 measurements were used on the azimuthaxis. These sample sizes were large enough to ensure that a very accurate measure of accuracy wasdefined.72
Chapter 9ConclusionsThe following conclusions have been drawn based on the functionality of the final system <strong><strong>an</strong>d</strong> the<strong>an</strong>alysis of the results obtained throughout the project:1. The accuracy of the movement on the azimuth axis in relation to the synchro reading was calculatedto be 0.1023 ◦ with a st<strong><strong>an</strong>d</strong>ard deviation of 0.0544 ◦ . This measure could be improvedby increasing the number of measurements taken.2. The accuracy of the movement on the elevation axis was calculated to be 0.0193 ◦ with ast<strong><strong>an</strong>d</strong>ard deviation of 0.0308 ◦ . This measure could be improved by increasing the number ofmeasurements taken.3. The backlash in the azimuth gearing was approximated to be 0.1892 ◦ . This gave <strong>an</strong> uncertaintyin the synchro reading of 0.1892 ◦ . Thus the total accuracy of the azimuth axis positioning wascalculated to be 0.2915 ◦ with a st<strong><strong>an</strong>d</strong>ard deviation of 0.0544 ◦ .4. This approximation <strong>for</strong> backlash was not very accurate as a lot of opportunities were availablein the testing to introduce hum<strong>an</strong> error into the measurement.5. The use of a non real-time Operating <strong>System</strong> <strong>for</strong> the <strong>API</strong> contributed to the error in the movementsas real-time measurements could not always be obtained.6. The controller implemented only used the current position of the pedestal to control the speedof movement. Thresholds were also defined according to experimental data which only relatedto the exact pedestal configuration used. If the weight of the <strong>an</strong>tenna is ch<strong>an</strong>ged, the dynamicsof the system will be altered <strong><strong>an</strong>d</strong> the controller thresholds would be invalid.7. The maximum speed of movement <strong>for</strong> the azimuth axis was not realised due to the azimuthcontrol hardware not being able to output a 100% duty cycle due to the 3.7V Parallel Portinputs.73
9. CONCLUSIONS8. There are m<strong>an</strong>y non-linearities in the movement of each axis due to the wear of the gearingsystems. Without conducting appropriate tests <strong><strong>an</strong>d</strong> deriving a control tr<strong>an</strong>sfer function,the dynamics of the system c<strong>an</strong>not be predicted <strong><strong>an</strong>d</strong> a controller with the maximum possibleaccuracy <strong><strong>an</strong>d</strong> minimum response time c<strong>an</strong>not be constructed.9. The <strong>over</strong>shoot <strong>for</strong> each speed was averaged <strong>over</strong> both directions, this posed a problem <strong>for</strong> theelevation axis as the weight of the <strong>an</strong>tenna ch<strong>an</strong>ges the <strong>over</strong>shoot depending on the currentposition. Thus the results <strong>for</strong> each direction were very different <strong><strong>an</strong>d</strong> averaging them gave thebest solution <strong>for</strong> the controller designed in this project, but limited the response of the systembecause undershoot <strong><strong>an</strong>d</strong> <strong>over</strong>shoot occurred often <strong><strong>an</strong>d</strong> the fine motor control method had torec<strong>over</strong> from this error.74
Chapter 10RecommendationsThe following recommendations are made <strong>for</strong> future work:1. Use commercial backlash measuring equipment <strong><strong>an</strong>d</strong> procedures to obtain a very accurate measurement<strong>for</strong> the backlash in the gearing systems.2. Use a real-time Operating <strong>System</strong> like RTLinux to allow <strong>for</strong> process priorities <strong><strong>an</strong>d</strong> schedulingalgorithms <strong>for</strong> the system to be set. This will ensure the system receives real-time measurementsfrom the synchros <strong><strong>an</strong>d</strong> c<strong>an</strong> per<strong>for</strong>m very accurate control.3. Increase the resolution (number of bits) of each DAC. This will enable the system to run atmore speeds <strong><strong>an</strong>d</strong> thus give better control. A separate Parallel Port <strong>for</strong> the elevation <strong><strong>an</strong>d</strong> azimuthaxes would be best.4. Use a driver circuit to ensure that the logic HIGH voltage from the Parallel Port enters theDAC as a 5V signal.5. Model the movement of the axes using control theory to obtain a tr<strong>an</strong>sfer function <strong>for</strong> thepedestal. This will allow <strong>for</strong> a controller which uses both speed <strong><strong>an</strong>d</strong> position to control themovement of the axes.75
Bibliography[1] Synchros <strong><strong>an</strong>d</strong> Resolvers [Training Presentation]. Gasking, J; North Atl<strong>an</strong>tic Industries;.[2] PWM <strong>Control</strong> MkII;. Available from: http://www.cpemma.co.uk/pwm_erg.html.[3] L298 [Datasheet]. STMicroelectronics; 2000.[4] LMD18200 [Datasheet]. National Semiconductor; 1999.[5] PCI-76CS1 [Datasheet]. North Atl<strong>an</strong>tic Industries; 2007.[6] Model 033-2T <strong><strong>an</strong>d</strong> 066-2T <strong>Tracking</strong> Pedestals. L-3 Brashear; [cited 20 October 2008]. Availablefrom: http://www.l-3com.com/brashear/markets/033-2t.htm.[7] A COMPARISON OF TRACKING PEDESTAL GEOMETRIES [M<strong>an</strong>ual]. ViaSat;.Available from: http://www.viasat.com/files/assets/support/m<strong>an</strong>uals/ComparisonofPedestalGeometries.pdf.[8] George G. A <strong>Control</strong> <strong><strong>an</strong>d</strong> Measurement <strong>System</strong> <strong>for</strong> <strong>an</strong> <strong>Elevation</strong> <strong>over</strong> <strong>Azimuth</strong> AntennaPedestal. University Of Cape Town, South Africa; 2007.[9] Synchro <strong><strong>an</strong>d</strong> Resolver Engineering H<strong><strong>an</strong>d</strong>book. MOOG Components Group Inc.; 2004.[10] Gasking J, Agosti R, Dayton D, Freilich A, Gr<strong><strong>an</strong>d</strong>ner W, Haber F, et al. Synchro <strong><strong>an</strong>d</strong> ResolverConversion H<strong><strong>an</strong>d</strong>book (Abridged Version). North Atl<strong>an</strong>tic Industries; 2005.[11] Johnson MW. VXI synchro/resolver <strong><strong>an</strong>d</strong> phase-<strong>an</strong>gle voltmeter COTS resources <strong>for</strong> F-15AADTS program ATE. In: Proc. IEEE AUTOTESTCON; 2000. p. 554–558.[12] Personal Communication [Email]. Riccobono F, Shafy A; North Atl<strong>an</strong>tic Industries; 2008.[13] Gloassary of Meteorology. Americ<strong>an</strong> Meteorological Society; [cited 20 October 2008]. Availablefrom: http://amsglossary.allenpress.com/glossary/browse?s=b&p=2 .[14] Unit Testing. Microsoft Developer Network; [cited 20 October 2008]. Available from: http://msdn.microsoft.com/en-us/library/aa292197(VS.71).aspx .76
BIBLIOGRAPHY[15] LM324 [Datasheet]. National Semiconductor; 1994.[16] 2N2222A [Datasheet]. STMicroelectronics; 1999.[17] A DMOS 3A, 55V, H-Bridge: The LMD18200 [Application Note 694]. National Semiconductor;1999.[18] KA78XX/KA78XXA [Datasheet]. Fairchild Semiconductor; 2001.[19] Writing Functional Tests [Wiki]. Zope;. Available from: http://wiki.zope.org/zope3/ftests.html.[20] Larson HJ. Introduction to Probability Theory <strong><strong>an</strong>d</strong> Statistical Inference. 2nd ed. John Wiley &Sons; 1974.[21] The Normal Distribution. Department of Statistics, St<strong>an</strong><strong>for</strong>d University; [cited 20 October2008]. Available from: http://www-stat.st<strong>an</strong><strong>for</strong>d.edu/~naras/jsm/NormalDensity/NormalDensity.html.[22] Silberschatz A, Galvin PB, Gagne G. Operating <strong>System</strong> Concepts. 7th ed. John Wiley & Sons;2005.[23] <strong>System</strong>s Engineering Guidebook <strong>for</strong> ITS. U.S. Department of Tr<strong>an</strong>sportation Federal HighwayAdministration; [cited 20 October 2008]. Glossary. Available from: http://www.fhwa.dot.gov/cadiv/segb/views/document/Sections/Section8/8_1_1.htm .[24] Lagerberg A, Egardt B. Backlash Estimation With Application to Automotive Powertrains.2007;15(3):483–493.[25] Lee KM, Zhou D. A real-time optical sensor <strong>for</strong> simult<strong>an</strong>eous measurement of three-DOFmotions. 2004;9(3):499–507.[26] Villwock S, Pacas M. Time Domain Identification Method <strong>for</strong> Detecting Mech<strong>an</strong>ical Backlashin Electrical Drives. IEEE Tr<strong>an</strong>sactions on. 2003;p. 1. Accepted <strong>for</strong> future publicationIndustrial Electronics.[27] Zhou J, Wen C, Zh<strong>an</strong>g Y. Adaptive backstepping control of a class of uncertain nonlinearsystems with unknown backlash-like hysteresis. 2004;49(10):1751–1759.[28] CD4043B [Datasheet]. Texas Instraments; 2003.[29] CD4081B [Datasheet]. Texas Instraments; 2003.[30] LM358 [Datasheet]. STMicroelectronics; 2002.77
BIBLIOGRAPHY[31] HCF4069UB [Datasheet]. STMicroelectronics; 2001.[32] TIP122 [Datasheet]. STMicroelectronics; 2000.78