Ministry of Envir<strong>on</strong>mentc<strong>on</strong>servati<strong>on</strong> of renewable natural resources 12%; ProtectedAreas 9%; instituti<strong>on</strong>al development and strengthening 7%(Figure 3-8).12%9%7%30%From 1991 to 1997, NGOs received more than half theresources (51%). Federal instituti<strong>on</strong>s received 15%, and 9%went to state agencies. Municipalities with less than 120,000inhabitants received 22%, and those with a populati<strong>on</strong> ofmore than 120,000 inhabitants received 3% (Figure 3-9). Interms of the number of projects supported; NGOs c<strong>on</strong>tributed54%; federal organs 17%; state agencies 14%; municipaldistricts with less than 120,000 inhabitants received 13% andthose with over 120,000 inhabitants 2% (Figure 3-10).C<strong>on</strong>sidering geographical regi<strong>on</strong>s, 31% of the projectswere in the south-east; 30% in the south; 14% in the centralwest;13% in the north-east and 12% in the north (Figure 3-10). In terms of the distributi<strong>on</strong> of the financial resources,the south received 32%; the south-east 31%; the north-east14%; the central-west 14%; and the north 9% (Figure 3-12).In terms of both the number of projects and the amount offinancing, more than 60% of the support was c<strong>on</strong>centratedin the south and south-east. The smaller participati<strong>on</strong> of thenorth and north-east is attributed to difficulties in formulatingtechnically adequate proposals, and less availability ofinformati<strong>on</strong> is available in these areas. Besides, there areother sources of funding available for the Amaz<strong>on</strong> (northernregi<strong>on</strong>). Of all the projects supported by FNMA (up to March1997), 141 were directly related to biodiversity, almost 30%and with a combined total of R$ 6,536,640.70.New resources in the order of US$ 75 milli<strong>on</strong> are being17%Envir<strong>on</strong>mental educati<strong>on</strong>and disseminati<strong>on</strong>Extractivism, ForestManagement/ C<strong>on</strong>servati<strong>on</strong>of natural resourcesResearch & technologicaldevelopmentProtected Areas25%Envir<strong>on</strong>mental C<strong>on</strong>trolInstituti<strong>on</strong>alstrengtheningand developmentFigure 3-8. The percentage of projects (totalling 498) in differentareas supported by the Nati<strong>on</strong>al Envir<strong>on</strong>ment Fund (FNMA)between November 1990 and September 1997.Source: <str<strong>on</strong>g>Brazil</str<strong>on</strong>g>, MMA, Secretaria de Coordenação dos Assuntosdo Meio Ambiente. 1997. O FNMA. Brasília. (Internal document).negotiated for the FNMA: US$ 45 milli<strong>on</strong> from a new IDBloan and US$ 30 milli<strong>on</strong> as the <str<strong>on</strong>g>Brazil</str<strong>on</strong>g>ian Governmentc<strong>on</strong>tributi<strong>on</strong>. The FNMA Co-ordinati<strong>on</strong> has already received275 project proposals for these resources, 39% of whichinvolve biodiversity (107 proposals totalling R$ 9,940,489.63).Thirty-four per cent of these proposals are from the south,28% from the south-east, 16% from the north-east, 12% fromthe central-west and 10% from the north. Thirty-five per centare from NGOs, 29% from small municipalities, 21% from federalorgans, 10% from municipal agencies, and 5% from thelarger municipal districts.14 %13 %6 %32 %According to topic, the largest demand is in the field offorestry extensi<strong>on</strong>, sustainable management andc<strong>on</strong>servati<strong>on</strong> of renewable natural resources (37%). Nextcomes technological research and development (32%),protected areas (25%, envir<strong>on</strong>mental c<strong>on</strong>trol (3%),envir<strong>on</strong>mental educati<strong>on</strong> and diffusi<strong>on</strong> (2%) andtechnological development and strengthening (1%).Extractivism, Forest Management/C<strong>on</strong>servati<strong>on</strong> of natural resourcesProtected areas16 % 19 %Envir<strong>on</strong>mental educati<strong>on</strong> & disseminati<strong>on</strong>Research and technological developmentEnvir<strong>on</strong>mental c<strong>on</strong>trolInstituti<strong>on</strong>al strengthening & developmentFigure 3-7. Distributi<strong>on</strong> of disbursements (totallingUS$26,021,003.86) for different thematic areas by the Nati<strong>on</strong>alEnvir<strong>on</strong>ment Fund (FNMA) between November 1990 andSeptember 1997.Source: <str<strong>on</strong>g>Brazil</str<strong>on</strong>g>, MMA, Secretaria de Coordenação dosAssuntos do meio Ambiente. 1997. O FNMA. Brasília.(Internal document).FNMA’s c<strong>on</strong>tributi<strong>on</strong> to the c<strong>on</strong>servati<strong>on</strong> and sustainableuse of biodiversity has involved support in a number ofareas:• The implantati<strong>on</strong> of protected areas and managementplans;• Restorati<strong>on</strong> of degraded areas with the establishmentof agroforestry systems, the rec<strong>on</strong>stituti<strong>on</strong> of galleryforest, and agro-ecological programmes;• Research <strong>on</strong> biodiversity in protected areas;• Training in the administrati<strong>on</strong> and management ofprotected areas;136
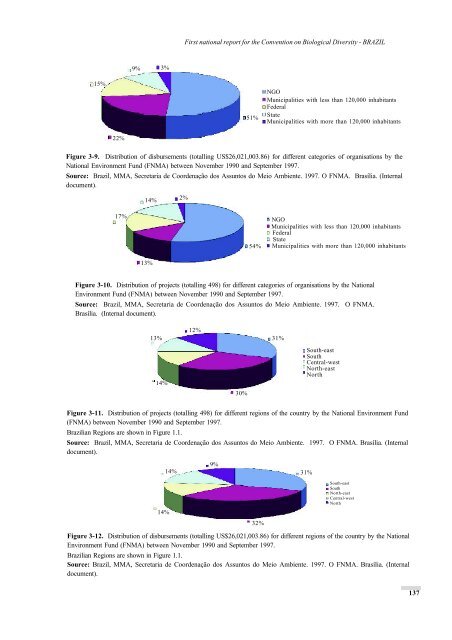
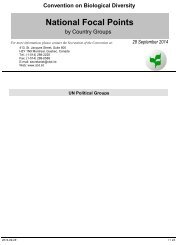
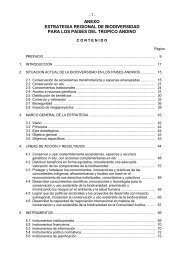
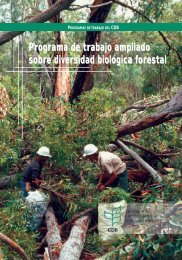
First nati<strong>on</strong>al report for the <str<strong>on</strong>g>C<strong>on</strong>venti<strong>on</strong></str<strong>on</strong>g> <strong>on</strong> <strong>Biological</strong> <strong>Diversity</strong> - BRAZIL9%3%15%51%NGOMunicipalities with less than 120,000 inhabitantsFederalStateMunicipalities with more than 120,000 inhabitants22%Figure 3-9. Distributi<strong>on</strong> of disbursements (totalling US$26,021,003.86) for different categories of organisati<strong>on</strong>s by theNati<strong>on</strong>al Envir<strong>on</strong>ment Fund (FNMA) between November 1990 and September 1997.Source: <str<strong>on</strong>g>Brazil</str<strong>on</strong>g>, MMA, Secretaria de Coordenação dos Assuntos do Meio Ambiente. 1997. O FNMA. Brasília. (Internaldocument).14%2%17%54%NGOMunicipalities with less than 120,000 inhabitantsFederalStateMunicipalities with more than 120,000 inhabitants13%Figure 3-10. Distributi<strong>on</strong> of projects (totalling 498) for different categories of organisati<strong>on</strong>s by the Nati<strong>on</strong>alEnvir<strong>on</strong>ment Fund (FNMA) between November 1990 and September 1997.Source: <str<strong>on</strong>g>Brazil</str<strong>on</strong>g>, MMA, Secretaria de Coordenação dos Assuntos do Meio Ambiente. 1997. O FNMA.Brasília. (Internal document).13%14%12%30%31%South-eastSouthCentral-westNorth-eastNorthFigure 3-11. Distributi<strong>on</strong> of projects (totalling 498) for different regi<strong>on</strong>s of the country by the Nati<strong>on</strong>al Envir<strong>on</strong>ment Fund(FNMA) between November 1990 and September 1997.<str<strong>on</strong>g>Brazil</str<strong>on</strong>g>ian Regi<strong>on</strong>s are shown in Figure 1.1.Source: <str<strong>on</strong>g>Brazil</str<strong>on</strong>g>, MMA, Secretaria de Coordenação dos Assuntos do Meio Ambiente. 1997. O FNMA. Brasília. (Internaldocument).14%14%9%32%31%South-eastSouthNorth-eastCentral-westNorthFigure 3-12. Distributi<strong>on</strong> of disbursements (totalling US$26,021,003.86) for different regi<strong>on</strong>s of the country by the Nati<strong>on</strong>alEnvir<strong>on</strong>ment Fund (FNMA) between November 1990 and September 1997.<str<strong>on</strong>g>Brazil</str<strong>on</strong>g>ian Regi<strong>on</strong>s are shown in Figure 1.1.Source: <str<strong>on</strong>g>Brazil</str<strong>on</strong>g>, MMA, Secretaria de Coordenação dos Assuntos do Meio Ambiente. 1997. O FNMA. Brasília. (Internaldocument).137