FICON Express2 Channel Performance Version 1.0 - IBM
FICON Express2 Channel Performance Version 1.0 - IBM
FICON Express2 Channel Performance Version 1.0 - IBM

Create successful ePaper yourself
Turn your PDF publications into a flip-book with our unique Google optimized e-Paper software.
<strong>FICON</strong> <strong>Express2</strong> <strong>Channel</strong> <strong>Performance</strong> <strong>Version</strong> <strong>1.0</strong><br />
Page 10<br />
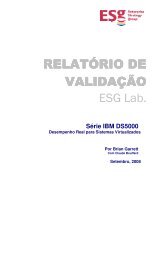
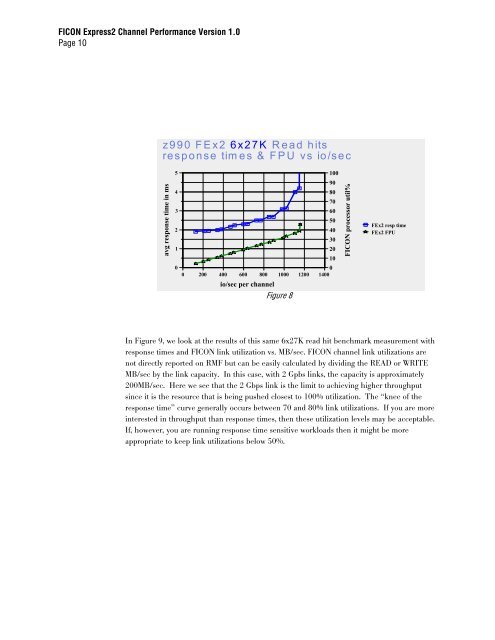
z990 FEx2 6x27K Read hits<br />
response times & FPU vs io/sec<br />
avg response time in ms<br />
5<br />
100<br />
90<br />
4<br />
80<br />
70<br />
3<br />
60<br />
50<br />
2<br />
40<br />
30<br />
1<br />
20<br />
10<br />
0<br />
0<br />
0 200 400 600 800 1000 1200 1400<br />
io/sec per channel<br />
Figure 8<br />
In Figure 9, we look at the results of this same 6x27K read hit benchmark measurement with<br />
response times and <strong>FICON</strong> link utilization vs. MB/sec. <strong>FICON</strong> channel link utilizations are<br />
not directly reported on RMF but can be easily calculated by dividing the READ or WRITE<br />
MB/sec by the link capacity. In this case, with 2 Gpbs links, the capacity is approximately<br />
200MB/sec. Here we see that the 2 Gbps link is the limit to achieving higher throughput<br />
since it is the resource that is being pushed closest to 100% utilization. The “knee of the<br />
response time” curve generally occurs between 70 and 80% link utilizations. If you are more<br />
interested in throughput than response times, then these utilization levels may be acceptable.<br />
If, however, you are running response time sensitive workloads then it might be more<br />
appropriate to keep link utilizations below 50%.<br />
<strong>FICON</strong> processor util%<br />
FEx2 resp time<br />
FEx2 FPU