FICON Express2 Channel Performance Version 1.0 - IBM
FICON Express2 Channel Performance Version 1.0 - IBM
FICON Express2 Channel Performance Version 1.0 - IBM

Create successful ePaper yourself
Turn your PDF publications into a flip-book with our unique Google optimized e-Paper software.
<strong>FICON</strong> <strong>Express2</strong> <strong>Channel</strong> <strong>Performance</strong> <strong>Version</strong> <strong>1.0</strong><br />
Page 14<br />
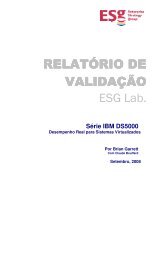
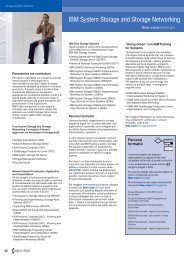
Figure 13 shows the <strong>FICON</strong> <strong>Express2</strong> channel PCI bus utilizations for this same 6x27K<br />
Read/Write mix benchmark. PCI bus utilizations are the bus utilizations reported on the<br />
RMF <strong>Channel</strong> activity report for <strong>FICON</strong> <strong>Express2</strong> channels but there is another internal<br />
channel bus whose utilization is roughly 1.5 to 2 times the PCI bus utilization. This internal<br />
channel bus is the real resource that limits the 6x27K Read/Write benchmark from achieving<br />
higher than 270MB/sec but it is highly unlikely that any real production workload would<br />
come anywhere near approaching this limit. For real production workloads, the most<br />
relevant resource limits to pay attention to are the channel and the control unit processor and<br />
link limits and these are the limits that I have highlighted for each benchmark measurement<br />
result presented in this paper.<br />
z990 FEx2 6x27K Read/write mix<br />
<strong>FICON</strong> Bus Utilization(FBU) vs MB/sec<br />
<strong>FICON</strong> bus utilization (FBU)<br />
100<br />
90<br />
80<br />
70<br />
60<br />
50<br />
40<br />
30<br />
20<br />
10<br />
0<br />
0 30 60 90 120 150 180 210 240 270 300<br />
Total READ + WRITE MB/sec<br />
Figure 13<br />
FEx2 FBU<br />
Figures 14 and 15 represent two different ways of looking at the results of the 27K or<br />
half-track read hit benchmark. The first figure below is a plot of response times and <strong>FICON</strong><br />
processor utilizations vs. io/sec. Here we see a sharp increase in response times just over<br />
6000 io/sec and at about 60% <strong>FICON</strong> processor utilization (FPU). The second 27K read hit<br />
graph plots response times and <strong>FICON</strong> channel link utilizations vs. MB/sec. The sharp<br />
increase in response times occurs at about 170 MB/sec which is about 85% of the maximum<br />
link capability and indicates that the 2 Gbps link is the limiting resource for this workload.<br />
But processor utilizations are pushed to high levels as well. The 27k read hit benchmark<br />
pushes both processor and link utilizations to high levels with link utilizations slightly higher<br />
than the processor.