FICON Express2 Channel Performance Version 1.0 - IBM
FICON Express2 Channel Performance Version 1.0 - IBM
FICON Express2 Channel Performance Version 1.0 - IBM

Create successful ePaper yourself
Turn your PDF publications into a flip-book with our unique Google optimized e-Paper software.
<strong>FICON</strong> <strong>Express2</strong> <strong>Channel</strong> <strong>Performance</strong> <strong>Version</strong> <strong>1.0</strong><br />
Page 6<br />
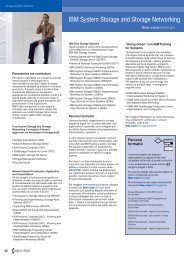
Recommended configuration for<br />
determining max capability of a CU port for<br />
benchmark testing<br />
multiple <strong>FICON</strong><br />
channels<br />
connected through<br />
a <strong>FICON</strong> director to<br />
a single CU port<br />
Figure 4<br />
The four basic DASD I/O driver benchmark programs used to evaluate the capabilities of the<br />
new <strong>FICON</strong> <strong>Express2</strong> channels are as follows:<br />
1. 4K bytes per I/O: this channel program processes small blocks of I/O and is capable of<br />
achieving high I/O per second rates but much lower MB/sec rates than large block<br />
channel programs. With the appropriate read/write ratios and CU cache hit ratios, this<br />
benchmark is representative of online transaction processing workloads.<br />
2. 6x27K bytes per I/O: this channel program processes 6 large blocks with 27K bytes each<br />
or 6 half-tracks of data and is capable of achieving high MB/sec but much lower I/O per<br />
second than the small block channel programs. It is representative of the type of channel<br />
programs used in disk to tape backup jobs or other highly sequential batch jobs.<br />
3. 27K bytes per I/O: this channel program processes a single half track of data and achieves<br />
both I/O per second and MB/sec that are in between the extremes of the 4K and 6x27K<br />
bytes per I/O benchmarks.<br />
4. 32x4K bytes per I/O: this channel program processes 32 small (4K byte) blocks of I/O and<br />
is representative of some DB2 pre-fetching utilities and other channel programs that<br />
process long chains of short blocks of data.<br />
Figure 5 below shows the average of all of the LCU (Logical Control Unit) response times for<br />
the 4k read hit benchmark measurement plotted with <strong>FICON</strong> Processor Utilization(FPU) %s .<br />
Response times in milliseconds are on the left y-axis. FPU %s are on the 2nd or right y-axis.<br />
The knee of the response time curve occurs around 10,000 I/O’s per second and just above<br />
70% <strong>FICON</strong> Processor utilization (FPU) when running this very simple 4K read hit<br />
benchmark workload. But most real production workloads are more complex than this<br />
z990<br />
<strong>FICON</strong><br />
<strong>Express2</strong><br />
<strong>Channel</strong>s<br />
W1,X2,Y3,Z4<br />
Director<br />
CU box