Dummy Variables and the Relationship of Deaf and ... - NESUG
Dummy Variables and the Relationship of Deaf and ... - NESUG
Dummy Variables and the Relationship of Deaf and ... - NESUG
- No tags were found...

You also want an ePaper? Increase the reach of your titles
YUMPU automatically turns print PDFs into web optimized ePapers that Google loves.
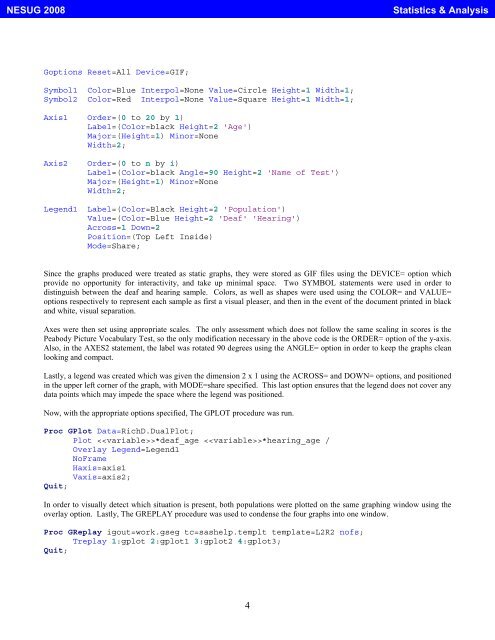
<strong>NESUG</strong> 2008Statistics & AnalysisGoptions Reset=All Device=GIF;Symbol1 Color=Blue Interpol=None Value=Circle Height=1 Width=1;Symbol2 Color=Red Interpol=None Value=Square Height=1 Width=1;Axis1 Order=(0 to 20 by 1)Label=(Color=black Height=2 'Age')Major=(Height=1) Minor=NoneWidth=2;Axis2 Order=(0 to n by i)Label=(Color=black Angle=90 Height=2 'Name <strong>of</strong> Test')Major=(Height=1) Minor=NoneWidth=2;Legend1 Label=(Color=Black Height=2 'Population')Value=(Color=Blue Height=2 '<strong>Deaf</strong>' 'Hearing')Across=1 Down=2Position=(Top Left Inside)Mode=Share;Since <strong>the</strong> graphs produced were treated as static graphs, <strong>the</strong>y were stored as GIF files using <strong>the</strong> DEVICE= option whichprovide no opportunity for interactivity, <strong>and</strong> take up minimal space. Two SYMBOL statements were used in order todistinguish between <strong>the</strong> deaf <strong>and</strong> hearing sample. Colors, as well as shapes were used using <strong>the</strong> COLOR= <strong>and</strong> VALUE=options respectively to represent each sample as first a visual pleaser, <strong>and</strong> <strong>the</strong>n in <strong>the</strong> event <strong>of</strong> <strong>the</strong> document printed in black<strong>and</strong> white, visual separation.Axes were <strong>the</strong>n set using appropriate scales. The only assessment which does not follow <strong>the</strong> same scaling in scores is <strong>the</strong>Peabody Picture Vocabulary Test, so <strong>the</strong> only modification necessary in <strong>the</strong> above code is <strong>the</strong> ORDER= option <strong>of</strong> <strong>the</strong> y-axis.Also, in <strong>the</strong> AXES2 statement, <strong>the</strong> label was rotated 90 degrees using <strong>the</strong> ANGLE= option in order to keep <strong>the</strong> graphs cleanlooking <strong>and</strong> compact.Lastly, a legend was created which was given <strong>the</strong> dimension 2 x 1 using <strong>the</strong> ACROSS= <strong>and</strong> DOWN= options, <strong>and</strong> positionedin <strong>the</strong> upper left corner <strong>of</strong> <strong>the</strong> graph, with MODE=share specified. This last option ensures that <strong>the</strong> legend does not cover anydata points which may impede <strong>the</strong> space where <strong>the</strong> legend was positioned.Now, with <strong>the</strong> appropriate options specified, The GPLOT procedure was run.Proc GPlot Data=RichD.DualPlot;Plot *deaf_age *hearing_age /Overlay Legend=Legend1NoFrameHaxis=axis1Vaxis=axis2;Quit;In order to visually detect which situation is present, both populations were plotted on <strong>the</strong> same graphing window using <strong>the</strong>overlay option. Lastly, The GREPLAY procedure was used to condense <strong>the</strong> four graphs into one window.Proc GReplay igout=work.gseg tc=sashelp.templt template=L2R2 n<strong>of</strong>s;Treplay 1:gplot 2:gplot1 3:gplot2 4:gplot3;Quit;4