Dummy Variables and the Relationship of Deaf and ... - NESUG
Dummy Variables and the Relationship of Deaf and ... - NESUG
Dummy Variables and the Relationship of Deaf and ... - NESUG
- No tags were found...

Create successful ePaper yourself
Turn your PDF publications into a flip-book with our unique Google optimized e-Paper software.
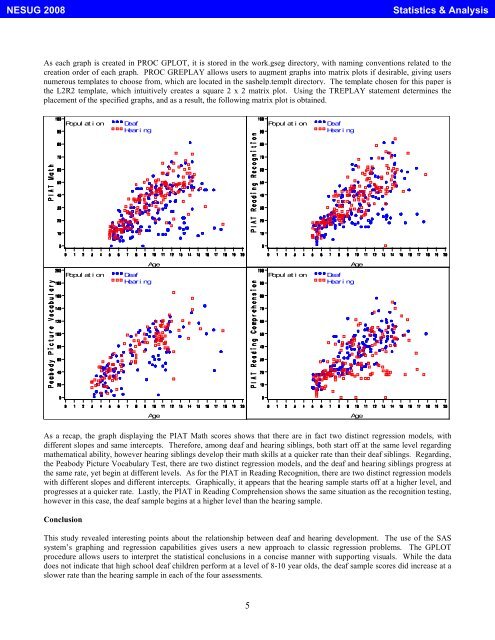
<strong>NESUG</strong> 2008Statistics & AnalysisAs each graph is created in PROC GPLOT, it is stored in <strong>the</strong> work.gseg directory, with naming conventions related to <strong>the</strong>creation order <strong>of</strong> each graph. PROC GREPLAY allows users to augment graphs into matrix plots if desirable, giving usersnumerous templates to choose from, which are located in <strong>the</strong> sashelp.templt directory. The template chosen for this paper is<strong>the</strong> L2R2 template, which intuitively creates a square 2 x 2 matrix plot. Using <strong>the</strong> TREPLAY statement determines <strong>the</strong>placement <strong>of</strong> <strong>the</strong> specified graphs, <strong>and</strong> as a result, <strong>the</strong> following matrix plot is obtained.Popul at i on<strong>Deaf</strong>Heari ngPopul at i on<strong>Deaf</strong>Heari ngAgeAgePopul at i on<strong>Deaf</strong>Heari ngPopul at i on<strong>Deaf</strong>Heari ngAgeAgeAs a recap, <strong>the</strong> graph displaying <strong>the</strong> PIAT Math scores shows that <strong>the</strong>re are in fact two distinct regression models, withdifferent slopes <strong>and</strong> same intercepts. Therefore, among deaf <strong>and</strong> hearing siblings, both start <strong>of</strong>f at <strong>the</strong> same level regardingma<strong>the</strong>matical ability, however hearing siblings develop <strong>the</strong>ir math skills at a quicker rate than <strong>the</strong>ir deaf siblings. Regarding,<strong>the</strong> Peabody Picture Vocabulary Test, <strong>the</strong>re are two distinct regression models, <strong>and</strong> <strong>the</strong> deaf <strong>and</strong> hearing siblings progress at<strong>the</strong> same rate, yet begin at different levels. As for <strong>the</strong> PIAT in Reading Recognition, <strong>the</strong>re are two distinct regression modelswith different slopes <strong>and</strong> different intercepts. Graphically, it appears that <strong>the</strong> hearing sample starts <strong>of</strong>f at a higher level, <strong>and</strong>progresses at a quicker rate. Lastly, <strong>the</strong> PIAT in Reading Comprehension shows <strong>the</strong> same situation as <strong>the</strong> recognition testing,however in this case, <strong>the</strong> deaf sample begins at a higher level than <strong>the</strong> hearing sample.ConclusionThis study revealed interesting points about <strong>the</strong> relationship between deaf <strong>and</strong> hearing development. The use <strong>of</strong> <strong>the</strong> SASsystem’s graphing <strong>and</strong> regression capabilities gives users a new approach to classic regression problems. The GPLOTprocedure allows users to interpret <strong>the</strong> statistical conclusions in a concise manner with supporting visuals. While <strong>the</strong> datadoes not indicate that high school deaf children perform at a level <strong>of</strong> 8-10 year olds, <strong>the</strong> deaf sample scores did increase at aslower rate than <strong>the</strong> hearing sample in each <strong>of</strong> <strong>the</strong> four assessments.5