Pre - Surgical Planning Laboratory
Pre - Surgical Planning Laboratory
Pre - Surgical Planning Laboratory
- No tags were found...

Create successful ePaper yourself
Turn your PDF publications into a flip-book with our unique Google optimized e-Paper software.
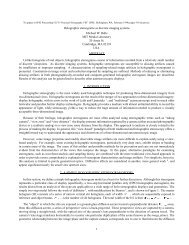
a) b)Fig. 2. In gure a) we show the tumor (arrow) in a pre-operative T2-weighted FSE. Inb) we can see the ablated area as a dark, ellipsoidal zone. But we also recognize thatduring the last three months, an outer rim of cancerous cells (arrow) grew around theinitial tumor.3 ResultsWe applied our planning tool to analyze the failure of a previously performedcryo-therapy case. In Figure 2a we see an axial slice of the pre-operative T2-weighted fast spin-echo (FSE) MR scan of the abdomen. The arrow points atthe tumor. In 2b, a slice of the 3-month follow-up scan (same modality) is shown.Unfortunately the tumor had re-appeared (arrow) and had grown very quicklyaround the eectively ablated zone. The analysis of this case was very importantas the radiologists were convinced of having completely frozen the whole tumorincluding the additional 0.5cm margin. In consequence, some concerns about thefrequently used hypothesis above arose. So we checked if, because of the failureof this treatment, the hypothesis has eectively to be questioned and, if not, topropose a safer treatment plan.3.1 Simulating the Treatment PlanIn Figure 3a and b, we simulate the setup that was chosen by the radiologists.This is easily possible as the treatment was performed under near-realtime MRguidance and interventional MR scans enable the visualization of the probes andof the growing iceballs.During pre-operative planning such a 3D view indicates if, for a certain setup,the probes are getting too close to important anatomical structures, suchasmainvessels or the gallbladder. Furthermore, a chosen probe might be too short toeectively reach its predetermined position in the tumor, and the radiologist candecide to take a longer probe.In a next step, we wanted to visualize the simulation of ablated tissue asdescribed in section Simulation. This is shown in Figure 4a, where the simulatediceball of the chosen setup is in red and the tumor, including the 0.5cm margin,in brown. Volume calculations indicate that just about 63% of the necessaryvolume are frozen in this setup. To increase this rather poor value, we applied