Magnetic anisotropy of textured CrO2 thin films investigated ... - KOPS
Magnetic anisotropy of textured CrO2 thin films investigated ... - KOPS
Magnetic anisotropy of textured CrO2 thin films investigated ... - KOPS

You also want an ePaper? Increase the reach of your titles
YUMPU automatically turns print PDFs into web optimized ePapers that Google loves.
748<br />
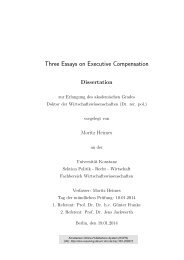
FIGURE 1 Scanning electron microscopy image <strong>of</strong> (010)-oriented <strong>CrO2</strong><br />
crystallites on a Cr2O3 (0001) initial layer [10]<br />
ple has been exposed to air. No further treatment has been<br />
performed.<br />
X-ray absorption spectra were recorded at the bending<br />
magnet beamline SX 700 III at BESSY I. The monochromator<br />
energy resolution was set to E/∆E ≈ 1200 and the<br />
degree <strong>of</strong> circular polarization was 0.69 ± 0.05. Two Keithley<br />
6517A electrometers were used for simultaneous measurement<br />
<strong>of</strong> the total drain sample current and the I0 current from<br />
an Au-coated Cu grid. The I0 grid was positioned in a µ-metal<br />
cylinder in order to prevent deviations produced by magnetic<br />
fields. A split-coil superconducting magnet system was used<br />
with a center bore <strong>of</strong> 5cmand a maximum magnetic field <strong>of</strong><br />
30 kOe. All spectra have been recorded at magnetic fields <strong>of</strong><br />
±5kOe. The XMCD signal was carefully checked for selfabsorption<br />
effects. Atomic absorption values <strong>of</strong> Cr and O have<br />
been extracted from tabulated values [11] and scaled to atomic<br />
densities in <strong>CrO2</strong>. We shifted and scaled our measured XAS<br />
spectra for both magnetization directions to fit the pre-edge region<br />
<strong>of</strong> oxygen and the post-edge region <strong>of</strong> Cr L2,3 edges <strong>of</strong><br />
the calculated tabulated values. Due to this procedure, the resonant<br />
behavior <strong>of</strong> the absorption in the near-edge region could<br />
be estimated quantitatively. The resulting absorption coefficient<br />
is shown in Fig. 2. We extracted an absolute absorption<br />
length for the maximal absorption <strong>of</strong> 35 nm, which is significantly<br />
larger than the expected effective mean free path length<br />
<strong>of</strong> about 1.5nm[12, 13]. After that, we modified our magnetic<br />
XAS spectrum (parallel and antiparallel alignment <strong>of</strong> helicity<br />
and magnetization) with the above-derived absolute absorption,<br />
using equation 5 and 7 from [13]. We compared observed<br />
small changes in the XAS spectra from normal to 60 ◦ incidence<br />
with simulated self-absorption-induced changes and<br />
could obtain the best agreement with our XAS data for an effective<br />
electron mean free path <strong>of</strong> only 0.7nm. We applied<br />
sum rules to the original and self-absorption-modified spectra<br />
and compared orbital and spin contributions. Absolute<br />
changes between normal and 60 ◦ incidence are for the spin<br />
moment <strong>of</strong> −0.005µB (−0.009µB) and for the orbital moment<br />
<strong>of</strong> −0.0004µB (−0.0008µB) using an effective electron mean<br />
free path [12, 13] <strong>of</strong> 0.7nm(1.5nm). In comparison to the results<br />
<strong>of</strong> Nakajima et al. [13], self-absorption effects are not as<br />
Absorbtion (1/µm)<br />
30<br />
20<br />
10<br />
0<br />
CrO 2<br />
Scaled XAS<br />
Henke Tables<br />
500 600 700 800<br />
Photon Energy (eV)<br />
FIGURE 2 XAS spectra scaled to absolute <strong>CrO2</strong> absorption values averaged<br />
for parallel and antiparallel alignments <strong>of</strong> the photon k-vector and the<br />
sample magnetization for normal incidence (full line) compared to <strong>CrO2</strong><br />
adapted Henke table [11] values (dotted line)<br />
strong as expected for a 3d 2 system. Two different reasons are<br />
responsible for this reduction. <strong>CrO2</strong> has hybridization-related<br />
broadened L2 and L3 white lines, and therefore a strongly reduced<br />
maximal absorption compared to a pure metal spectrum<br />
with the same number <strong>of</strong> 3d holes. On the other hand, the chromium<br />
density and the Cr-related absorption coefficient are<br />
strongly reduced by dilution. Due to the nonlinear behavior,<br />
self-absorption is magnetically more effective for large differences<br />
between parallel and antiparallel orientations <strong>of</strong> sample<br />
magnetization and photon helicity, which is present in Fe or<br />
Co spectra but not in our <strong>CrO2</strong> spectra.<br />
To prevent XMCD <strong>of</strong>fset signals, we applied a small<br />
asymmetry <strong>of</strong> about 0.2kOe in the external magnetic field,<br />
which does not influence the total sample magnetization [14].<br />
To get a derivative-free XMCD signal the external magnetic<br />
field was flipped at each energy position. All shown XAS<br />
and XMCD spectra have been divided by the I0 current,<br />
background-subtracted and edge-normalized. For parallel and<br />
antiparallel field alignments we used exactly the same background<br />
and the same normalization factor; therefore the shape<br />
<strong>of</strong> the dichroism spectrum is not affected. The photon beam<br />
was parallel aligned to the magnetic field. We show X-rayabsorption<br />
data for normal incidence Φ = 0 ◦ and more grazing<br />
incidence Φ = 60 ◦ (the geometry <strong>of</strong> the experimental<br />
setup is shown in Fig. 3).<br />
The upper part <strong>of</strong> Fig. 4 shows the Cr L2,3 normalincidence<br />
absorption spectra <strong>of</strong> <strong>CrO2</strong> for parallel and antiparallel<br />
alignments <strong>of</strong> the photon k-vector and the applied<br />
magnetic field. In the lower part <strong>of</strong> Fig. 4 the corresponding<br />
XMCD signal for normal and grazing (60 ◦ ) incidence<br />
is shown. An unusually clear and pronounced change in the<br />
spectral shape <strong>of</strong> the XMCD signal is clearly observable.<br />
For a quantitative analysis, we calculated the projected orbital<br />
moments for the two given angles <strong>of</strong> incidence using<br />
sum rules [15, 16]. With a number <strong>of</strong> core holes nh = 8 (3d 2<br />
configuration) we extract raw values <strong>of</strong> projected orbital moments<br />
for normal incidence Lz(0 ◦ ) =−0.041µB and for more<br />
grazing incidence Lz (60 ◦ ) =−0.016µB. Unfortunately, we