Magnetic anisotropy of textured CrO2 thin films investigated ... - KOPS
Magnetic anisotropy of textured CrO2 thin films investigated ... - KOPS
Magnetic anisotropy of textured CrO2 thin films investigated ... - KOPS

You also want an ePaper? Increase the reach of your titles
YUMPU automatically turns print PDFs into web optimized ePapers that Google loves.
750<br />
the present broadening in the <strong>CrO2</strong> L2,3 spectra compared<br />
to the pure metal spectra is related to hybridization effects.<br />
It is clear that, in a covalent type <strong>of</strong> bonding, different electron<br />
configurations could be present (for example d 1 , d 2 or<br />
d 3 ), which could yield to correlation effects. These results in<br />
multiplet-like features, which are considered by a configuration<br />
interaction (CI) ligand-field multiplet calculation. Early<br />
calculations <strong>of</strong> de Groot et al. [23] have shown that the cubic<br />
crystal field is very strong. Recent results <strong>of</strong> van Elp and<br />
Tanaka [24] clearly mention the dominating part <strong>of</strong> the crystal<br />
symmetry and the strength <strong>of</strong> oxygen hybridization to O<br />
K-edge spectral features <strong>of</strong> some TM oxides. From this point<br />
<strong>of</strong> view, crystal-field effects are strong and the resulting energies<br />
<strong>of</strong> the CI calculations nearly represent band-structure<br />
center-<strong>of</strong>-gravity positions. The below-described quite good<br />
agreement between experiment and fit, the direct correspondence<br />
to the band-structure-related projected density <strong>of</strong> states<br />
(DOS) and the reduced number <strong>of</strong> free fitting parameters give<br />
strong support that the moment analysis is a good representation<br />
<strong>of</strong> the XMCD spectra that leads to well-separated L2 and<br />
L3 spectral features.<br />
3.2 Application to <strong>CrO2</strong><br />
It has been verified that oxygen K-edge spectra<br />
represent the 2p hybridized part <strong>of</strong> the band structure and give<br />
an image <strong>of</strong> the unoccupied projected O2p DOS [25]. Influences<br />
<strong>of</strong> the core hole could be considered by a configurationinteraction<br />
scheme [24]. Due to this projection behavior, the<br />
main features could be understood by quantitative comparison<br />
to recent band-structure calculations [1–3, 26]. O K spectra<br />
and band-structure calculations could give similar information.<br />
We have separated O K-edge spectra <strong>of</strong> <strong>CrO2</strong> into<br />
two different regions. First, 1eV above threshold, which is<br />
unambiguously identified as unoccupied t2g majority states<br />
and, second, a broader feature around 3eVabove, which corresponds<br />
to a mixture <strong>of</strong> t2g eg minority and the eg majority<br />
states [27]. The latter represents band-structure-related<br />
values [1–3, 26]. This energy separation is also present in<br />
<strong>CrO2</strong> L2,3 spectra, which have a more complicated shape<br />
compared to simple pure and metallic TM spectra. The total<br />
width <strong>of</strong> the broader structure is about 7eV[1], but the dominating<br />
part has a FWHM <strong>of</strong> only 3eV. Considering the given<br />
arguments, we try to interpret the L2,3 XAS and XMCD spectra<br />
by the use <strong>of</strong> only two different energies for the moment<br />
Energy 1 FWHM 1 Energy 2 FWHM 2 2p SOC Eff. 2p3d exch.<br />
577.6eV 1.3 eV 580.5eV 3.3eV 9.3eV 0.45 eV<br />
TABLE 1 Fixed-fit parameters for moment analysis<br />
E0 = 577.6eV E1 = 580.5eV<br />
Angle w000 w011 w101 w000 w011 w101 w110 ∝ nh ∝ Sz ∝ Lz ∝ nh ∝ Sz ∝ Lz ∝ L<br />
Sz0 + Sz1 Lz0 + Lz1<br />
∗S (arb. units) (µB) (µB) (arb. units) (µB) (µB) (arb. units) (µB) (µB)<br />
0◦ 1.03 0.25 0.05 49.8 0.73 –0.15 3.3 0.98 –0.1<br />
60◦ 1.29 0.12 0.11 44.8 0.34 –0.14 21.9 0.46 –0.03<br />
analysis, which are separated by 2.9eV, and only Lorentzian<br />
line broadening has been applied. For a reduction <strong>of</strong> free<br />
fitting parameters, the energy position, line width, effective<br />
2p3d exchange and the 2p SOC energy (see Table 1)<br />
are previously estimated and have been held fixed. Also, the<br />
sum <strong>of</strong> the projected orbital moments was constrained to the<br />
above-discussed sum-rule values. All fixed parameters are<br />
shown in Table 1. The FWHM values have been chosen to fit<br />
the XMCD data and to match roughly band-structure-related<br />
values. The value for the 2p SOC energy has been taken<br />
from [28, 29].<br />
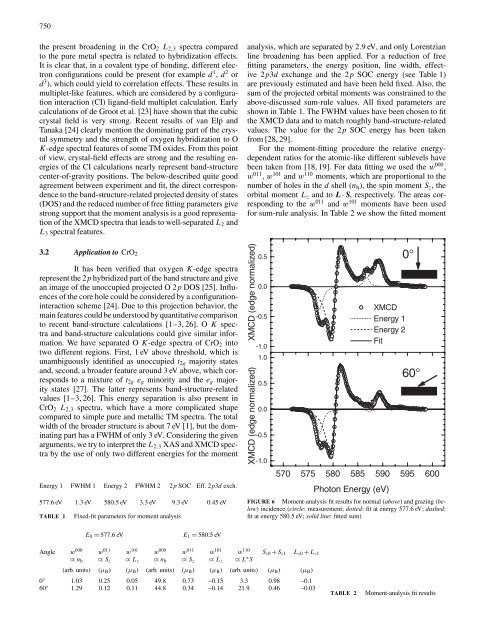
For the moment-fitting procedure the relative energydependent<br />
ratios for the atomic-like different sublevels have<br />
been taken from [18, 19]. For data fitting we used the w 000 ,<br />
w 011 , w 101 and w 110 moments, which are proportional to the<br />
number <strong>of</strong> holes in the d shell (nh), the spin moment Sz, the<br />
orbital moment Lz and to L · S, respectively. The areas corresponding<br />
to the w 011 and w 101 moments have been used<br />
for sum-rule analysis. In Table 2 we show the fitted moment<br />
XMCD (edge normalized)<br />
XMCD (edge normalized)<br />
0.5<br />
0.0<br />
-0.5<br />
-1.0<br />
1.0<br />
0.5<br />
0.0<br />
-0.5<br />
-1.0<br />
0°<br />
60°<br />
570 575 580 585 590 595 600<br />
Photon Energy (eV)<br />
XMCD<br />
Energy 1<br />
Energy 2<br />
Fit<br />
FIGURE 6 Moment-analysis fit results for normal (above) and grazing (below)<br />
incidence (circle: measurement; dotted: fit at energy 577.6eV;dashed:<br />
fit at energy 580.5eV;solid line: fitted sum)<br />
TABLE 2 Moment-analysis fit results