University of California - Leif and Vera Svalgaard's
University of California - Leif and Vera Svalgaard's
University of California - Leif and Vera Svalgaard's
- No tags were found...

Create successful ePaper yourself
Turn your PDF publications into a flip-book with our unique Google optimized e-Paper software.
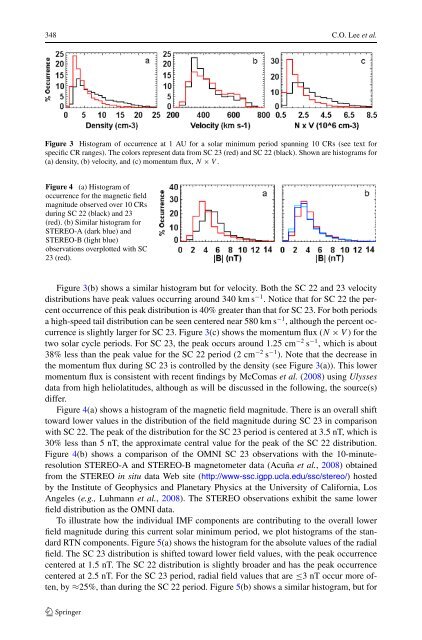
348 C.O. Lee et al.Figure 3 Histogram <strong>of</strong> occurrence at 1 AU for a solar minimum period spanning 10 CRs (see text forspecific CR ranges). The colors represent data from SC 23 (red) <strong>and</strong> SC 22 (black). Shown are histograms for(a) density, (b) velocity, <strong>and</strong> (c) momentum flux, N × V .Figure 4 (a) Histogram <strong>of</strong>occurrence for the magnetic fieldmagnitude observed over 10 CRsduring SC 22 (black) <strong>and</strong> 23(red). (b) Similar histogram forSTEREO-A (dark blue) <strong>and</strong>STEREO-B (light blue)observations overplotted with SC23 (red).Figure 3(b) shows a similar histogram but for velocity. Both the SC 22 <strong>and</strong> 23 velocitydistributions have peak values occurring around 340 km s −1 . Notice that for SC 22 the percentoccurrence <strong>of</strong> this peak distribution is 40% greater than that for SC 23. For both periodsa high-speed tail distribution can be seen centered near 580 km s −1 , although the percent occurrenceis slightly larger for SC 23. Figure 3(c) shows the momentum flux (N × V )forthetwo solar cycle periods. For SC 23, the peak occurs around 1.25 cm −2 s −1 , which is about38% less than the peak value for the SC 22 period (2 cm −2 s −1 ). Note that the decrease inthe momentum flux during SC 23 is controlled by the density (see Figure 3(a)). This lowermomentum flux is consistent with recent findings by McComas et al. (2008) usingUlyssesdata from high heliolatitudes, although as will be discussed in the following, the source(s)differ.Figure 4(a) shows a histogram <strong>of</strong> the magnetic field magnitude. There is an overall shifttoward lower values in the distribution <strong>of</strong> the field magnitude during SC 23 in comparisonwith SC 22. The peak <strong>of</strong> the distribution for the SC 23 period is centered at 3.5 nT, which is30% less than 5 nT, the approximate central value for the peak <strong>of</strong> the SC 22 distribution.Figure 4(b) shows a comparison <strong>of</strong> the OMNI SC 23 observations with the 10-minuteresolutionSTEREO-A <strong>and</strong> STEREO-B magnetometer data (Acuña et al., 2008) obtainedfrom the STEREO in situ data Web site (http://www-ssc.igpp.ucla.edu/ssc/stereo/) hostedby the Institute <strong>of</strong> Geophysics <strong>and</strong> Planetary Physics at the <strong>University</strong> <strong>of</strong> <strong>California</strong>, LosAngeles (e.g., Luhmann et al., 2008). The STEREO observations exhibit the same lowerfield distribution as the OMNI data.To illustrate how the individual IMF components are contributing to the overall lowerfield magnitude during this current solar minimum period, we plot histograms <strong>of</strong> the st<strong>and</strong>ardRTN components. Figure 5(a) shows the histogram for the absolute values <strong>of</strong> the radialfield. The SC 23 distribution is shifted toward lower field values, with the peak occurrencecentered at 1.5 nT. The SC 22 distribution is slightly broader <strong>and</strong> has the peak occurrencecentered at 2.5 nT. For the SC 23 period, radial field values that are ≤3 nT occur more <strong>of</strong>ten,by ≈25%, than during the SC 22 period. Figure 5(b) shows a similar histogram, but for
![When the Heliospheric Current Sheet [Figure 1] - Leif and Vera ...](https://img.yumpu.com/51383897/1/190x245/when-the-heliospheric-current-sheet-figure-1-leif-and-vera-.jpg?quality=85)
![The sum of two COSine waves is equal to [twice] the product of two ...](https://img.yumpu.com/32653111/1/190x245/the-sum-of-two-cosine-waves-is-equal-to-twice-the-product-of-two-.jpg?quality=85)