University of California - Leif and Vera Svalgaard's
University of California - Leif and Vera Svalgaard's
University of California - Leif and Vera Svalgaard's
- No tags were found...

Create successful ePaper yourself
Turn your PDF publications into a flip-book with our unique Google optimized e-Paper software.
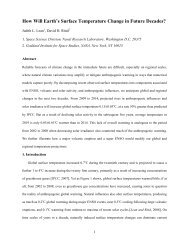
352 C.O. Lee et al.Figure 10 Color contour plotfor the SC 22 time period. Shownare contours for (top panel)velocity (km s −1 ) <strong>and</strong> (bottompanel) magnetic field magnitude(nT).high-speed stream structure commences on days 13 to 18. In contrast, the trailing part <strong>of</strong>the high-speed streams observed in the SC 23 period shows a more abrupt decline. Thespeeds go from ≈550 km s −1 (yellow – green) to ≈400 km s −1 in a day or so, followedby a sharp transition to speeds below 350 km s −1 (blue), which lasts for several days beforethe next high-speed stream onset. Figure 10 (bottom panel) shows the magnetic fieldmagnitude observed at this time. Notice that during SC 22 the field magnitudes have moremid-range (green to yellow) <strong>and</strong> high (red) field values <strong>and</strong> fewer low field values (blue)when compared to the current cycle. In addition, the ridges <strong>of</strong> high magnetic field magnitudes(red) do not necessarily occur during the onset <strong>of</strong> the high-speed streams, nordo the low field values always occur during the trailing part <strong>of</strong> the high-speed streams.We note that some solar transient events occurred during the time periods presented. Thenumber <strong>of</strong> interplanetary coronal mass ejections (ICMEs) observed during the SC 22 periodis eight compared to two during the SC 23 time period (see Jian et al., 2006, <strong>and</strong>http://www-ssc.igpp.ucla.edu/forms/stereo/stereo_level_3.html). This may in part explain theless organized nature <strong>of</strong> the SC 22 period.We also examine the correlation between the observed densities <strong>and</strong> field magnitudes.Figure 11 shows color contours <strong>of</strong> the statistics <strong>of</strong> the magnetic field magnitudes versusdensity. The maximum values in the distribution are shown in red. For the SC 22 distribution,Figure 11(a) shows that the maximum occurrence ranges between field magnitudes<strong>of</strong> around 4 – 6 nT <strong>and</strong> density values <strong>of</strong> around 2 – 6 cm −3 . For the SC 23 distribution(Figure 11(b)), the maximum occurrence distribution is shifted toward lower values in fieldmagnitude <strong>and</strong> broader in range, from approximately 2 to 5.5 nT. The density distribution isshifted toward lower values as well (about 1.5 – 6 cm −3 ). Overall, the recent SC 23 periodexhibits both lower field magnitudes <strong>and</strong> densities, consistent with the conclusions derivedfrom Figures 5 through 10.4. Origin <strong>of</strong> the Low IMFTo determine the nature <strong>of</strong> the differences in the present cycle interplanetary fields <strong>and</strong>their possible relationship to the weak solar polar fields mentioned in Section 1, itisnecessary to consider their origins. Although we do not show this, from the computed
![When the Heliospheric Current Sheet [Figure 1] - Leif and Vera ...](https://img.yumpu.com/51383897/1/190x245/when-the-heliospheric-current-sheet-figure-1-leif-and-vera-.jpg?quality=85)


![The sum of two COSine waves is equal to [twice] the product of two ...](https://img.yumpu.com/32653111/1/190x245/the-sum-of-two-cosine-waves-is-equal-to-twice-the-product-of-two-.jpg?quality=85)