AAPG Explorer - American Association of Petroleum Geologists
AAPG Explorer - American Association of Petroleum Geologists
AAPG Explorer - American Association of Petroleum Geologists

Create successful ePaper yourself
Turn your PDF publications into a flip-book with our unique Google optimized e-Paper software.
<strong>AAPG</strong><br />
EXPLORER<br />
GEOPHYSICALCORNER<br />
As has been emphasized in the<br />
three preceding articles <strong>of</strong> this<br />
series, when a shear (S) wave<br />
propagates through a rock unit that<br />
has aligned vertical fractures, it<br />
splits into two S waves – a fast-S (S1)<br />
mode and a slow-S (S2) mode.<br />
The S1 mode is polarized in the same<br />
direction as the fracture orientation;<br />
the S2 mode is polarized in a direction<br />
orthogonal to the<br />
fracture planes.<br />
This month<br />
we translate the<br />
principles established<br />
by laboratory<br />
experiments<br />
discussed in the<br />
preceding articles<br />
<strong>of</strong> this series into<br />
HARDAGE<br />
exploration practice.<br />
* * *<br />
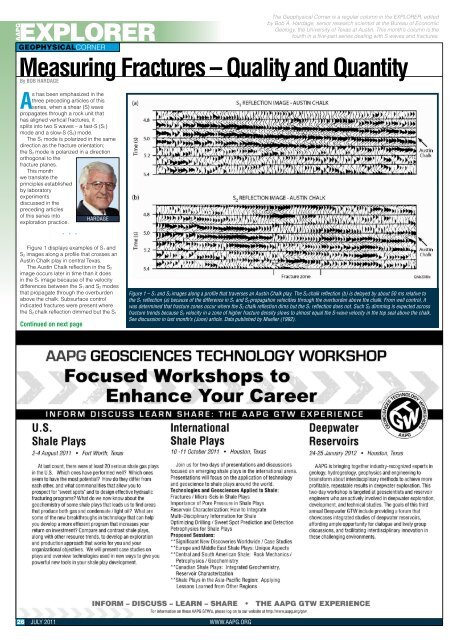
Figure 1 displays examples <strong>of</strong> S1 and<br />
S2 images along a pr<strong>of</strong>ile that crosses an<br />
Austin Chalk play in central Texas.<br />
The Austin Chalk reflection in the S2<br />
image occurs later in time than it does<br />
in the S1 image because <strong>of</strong> the velocity<br />
differences between the S1 and S2 modes<br />
that propagate through the overburden<br />
above the chalk. Subsurface control<br />
indicated fractures were present where<br />
the S2 chalk reflection dimmed but the S1<br />
26 JULY 2011 WWW.<strong>AAPG</strong>.ORG<br />
The Geophysical Corner is a regular column in the EXPLORER, edited<br />
by Bob A. Hardage, senior research scientist at the Bureau <strong>of</strong> Economic<br />
Geology, the University <strong>of</strong> Texas at Austin. This month’s column is the<br />
fourth in a five-part series dealing with S waves and fractures.<br />
Measuring Fractures – Quality and Quantity<br />
By BOB HARDAGE<br />
Continued on next page<br />
Figure 1 – S1 and S2 images along a pr<strong>of</strong>ile that traverses an Austin Chalk play. The S2 chalk reflection (b) is delayed by about 50 ms relative to<br />
the S1 reflection (a) because <strong>of</strong> the difference in S1 and S2 propagation velocities through the overburden above the chalk. From well control, it<br />
was determined that fracture zones occur where the S2 chalk reflection dims but the S1 reflection does not. Such S2 dimming is expected across<br />
fracture trends because S2 velocity in a zone <strong>of</strong> higher fracture density slows to almost equal the S-wave velocity in the top seal above the chalk.<br />
See discussion in last month’s (June) article. Data published by Mueller (1992).