Travel Management Priorities for 2013 - Carlson Wagonlit Travel
Travel Management Priorities for 2013 - Carlson Wagonlit Travel
Travel Management Priorities for 2013 - Carlson Wagonlit Travel

You also want an ePaper? Increase the reach of your titles
YUMPU automatically turns print PDFs into web optimized ePapers that Google loves.
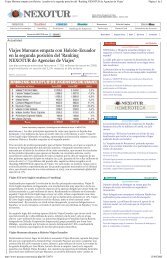
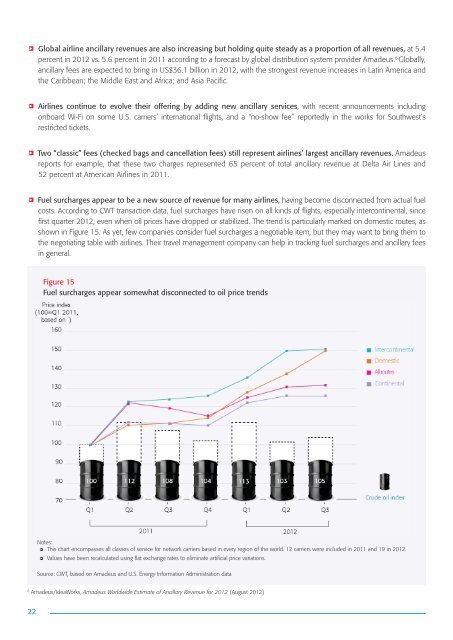
Global airline ancillary revenues are also increasing but holding quite steady as a proportion of all revenues, at 5.4percent in 2012 vs. 5.6 percent in 2011 according to a <strong>for</strong>ecast by global distribution system provider Amadeus. 6 Globally,ancillary fees are expected to bring in US$36.1 billion in 2012, with the strongest revenue increases in Latin America andthe Caribbean; the Middle East and Africa; and Asia Pacific.Airlines continue to evolve their offering by adding new ancillary services, with recent announcements includingonboard Wi-Fi on some U.S. carriers’ international flights, and a “no-show fee” reportedly in the works <strong>for</strong> Southwest’srestricted tickets.Two “classic” fees (checked bags and cancellation fees) still represent airlines’ largest ancillary revenues. Amadeusreports <strong>for</strong> example, that these two charges represented 65 percent of total ancillary revenue at Delta Air Lines and52 percent at American Airlines in 2011.Fuel surcharges appear to be a new source of revenue <strong>for</strong> many airlines, having become disconnected from actual fuelcosts. According to CWT transaction data, fuel surcharges have risen on all kinds of flights, especially intercontinental, sincefirst quarter 2012, even when oil prices have dropped or stabilized. The trend is particularly marked on domestic routes, asshown in Figure 15. As yet, few companies consider fuel surcharges a negotiable item, but they may want to bring them tothe negotiating table with airlines. Their travel management company can help in tracking fuel surcharges and ancillary feesin general.Figure 15Fuel surcharges appear somewhat disconnected to oil price trendsNotes:This chart encompasses all classes of service <strong>for</strong> network carriers based in every region of the world. 12 carriers were included in 2011 and 19 in 2012.Values have been recalculated using flat exchange rates to eliminate artificial price variations.Source: CWT, based on Amadeus and U.S. Energy In<strong>for</strong>mation Administration data6Amadeus/IdeaWorks, Amadeus Worldwide Estimate of Ancillary Revenue <strong>for</strong> 2012 (August 2012)22