Linkwitz-Riley Crossovers: A Primer - Power Amp Kits by AmpsLab
Linkwitz-Riley Crossovers: A Primer - Power Amp Kits by AmpsLab
Linkwitz-Riley Crossovers: A Primer - Power Amp Kits by AmpsLab

You also want an ePaper? Increase the reach of your titles
YUMPU automatically turns print PDFs into web optimized ePapers that Google loves.
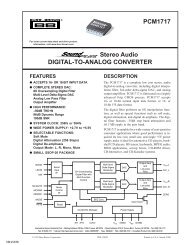
Time Corrected SoundPropagation PlaneTime Corrected SoundPropagation PlaneCancellation Axis3. Cancellation Axis1. On-Axis0 dBOn-Axis+3 dBPeaking2. Peaking AxisNo PeakingCancellation Axis3. Cancellation AxisCombined AcousticRadiation PatternCombined AcousticRadiation PatternFigure 1a.Figure 2. <strong>Linkwitz</strong>-<strong>Riley</strong> radiation response at crossover.+30<strong>Amp</strong>litude (dB)1. On-Axis3. Cancellation Axis1700 HzFrequency (Hz)2. Peaking AxisFigure 1b. Butterworth all-pass design radiation pattern atcrossover.What is seen is a series of peaking and cancellationnodes. Back to the string: holding it taut again andparallel to the floor puts you on-axis. Figure 1a tells usthat the magnitude of the emitted 1700 Hz tone willbe 0 dB (a nominal reference point). As you lower yourhead, the tone increases in loudness until a 3 dB peak isreached at 15 degrees below parallel. Raising your headabove the on-axis line causes a reduction in magnitudeuntil 15 degrees is reached where there is a completecancellation of the tone. There is another cancellationaxis located 49 degrees below the on-axis. Figure 1bdepicts the frequency response of the three axes forreference.For a constant voltage design, the response looksworse, having a 6 dB peaking axis located at -20 degreesand the cancellation axes at +10 and -56 degrees,respectively. The peaking axis tilts toward the laggingdriver in both cases, due to phase shift between thetwo crossover outputs.The cancellation nodes are not due to the crossoverdesign, they are due to the vertically displaced drivers.(The crossover design controls where cancellationnodes occur, not that they occur.) The fact that the<strong>Linkwitz</strong>-<strong>Riley</strong>-
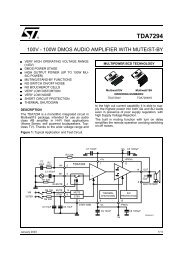
Cancellation AxisOn AxisPeaking AxisCancellation AxisFigure 3. Butterworth all-pass crossover stage-audience relationship.Cancellation AxisCancellation AxisOn AxisFigure 4. <strong>Linkwitz</strong>-<strong>Riley</strong> crossover stage-audience relationship.drivers are not coaxial means that any vertical deviationfrom the on-axis line results in a slight, but verysignificant difference in path lengths to the listener.This difference in distance traveled is effectively aphase shift between the drivers. And this causes cancellationnodes — the greater the distance betweendrivers, the more nodes.In distinct contrast to these examples is Figure2, where the combined response of a <strong>Linkwitz</strong>-<strong>Riley</strong>crossover design is shown. There is no tilt and no peaking— just a perfect response whose only limitation isthe dispersion characteristics of the drivers. The maincontributor to this ideal response is the in-phase relationshipbetween the crossover outputs.Two of the cancellation nodes are still present, butare well defined and always symmetrical about theon-axis plane. Their location changes with crossoverfrequency and driver mounting geometry (distancebetween drivers). With the other designs, the peakingand cancellation axes change with frequency and driverspacing.Let’s drop the string and move out into the audienceto see how these cancellation and peaking nodes affectthings. Figure 3 shows a terribly simplified, but not tooinaccurate stage-audience relationship with the characteristicsof Figure 1 added.The band is cooking and then comes to a musicalbreak. All eyes are on the flautist, who immediately goesinto her world-famous 1700 Hz solo. So what happens?The people in the middle hear it sweet, while those upfront are blown out of their seats, and those in the backare wondering what the hell all the fuss is!Figure 4 shows the identical situation but with the<strong>Linkwitz</strong>-<strong>Riley</strong> characteristics of Figure 2 added. Nowthe people in the middle still hear everything sweet,but those up front are not blown away, and those in theback understand the fuss!I think you get the point.Now let’s get real. I mean really real. The system isn’ttwo way, it is four way. There isn’t one enclosure, thereare sixteen. No way are the drivers 7 inches apart — try27 inches. And time corrected? Fuhgeddaboudit.Can you even begin to imagine what the verticaloff-axis response will look like with classic crossoverdesigns? The further apart the drivers are, the greaterthe number of peaks and cancellations, resulting in amulti-lobe radiation pattern. Each crossover frequencyhas its own set of patterns, complicated <strong>by</strong> each enclosurecontributing even more patterns. And so on.(For large driver spacing the <strong>Linkwitz</strong>-<strong>Riley</strong> designhas as many lobes as other designs, except that thepeaks are always 0 dB, and the main lobe is alwayson-axis.)Note that all this is dealing with the direct soundfield, no multiple secondary arrivals or room interferenceor reverberation times are being considered. Is itany wonder that when you move your real-time analyzermicrophone three feet you get a totally differentresponse?Now let me state clearly that using a <strong>Linkwitz</strong>-<strong>Riley</strong>crossover will not solve all these problems. But it willgo a long way toward that goal.<strong>Linkwitz</strong>-<strong>Riley</strong>-
We use these facts to create a crossover network.Figure 8 shows such a circuit. By interchanging the positionsof the resistor and capacitor, low-pass (low frequencies= LF) and high-pass (high frequencies = HF)filters result. For the low-pass case (LF), the capacitorignores low frequencies and shunts all high frequenciesto ground. For the high-pass case (HF), the oppositeoccurs. All low frequencies are blocked and only highfrequencies are passed.1st-Order <strong>Amp</strong>litude ResponseUsing 1 kHz as an example and plotting the amplitudeversus frequency response (Figure 9) reveals the expectedlow-pass and high-pass shapes. Figure 9 showsthat the 1st-order circuit exhibits 6 dB/octave slopes.Also, that 6 dB/octave equals 20 dB/decade. Bothways of expressing steepness are useful and should bememorized. The rule is: each order, or degree, of afilter increases the slopes <strong>by</strong> 6 dB/octave or 20 dB/decade. So, for example, a 4th-order (or 4th-degree—interchangeable terms) circuit has 24 dB/octave (4 x 6dB/octave) or 80 dB/decade (4 x 20 dB/decade) slopes.Using equal valued resistors and capacitors in eachof the circuits causes the amplitude responses to ‘crossover’ at one particular frequency where their respective-3 dB points intersect. This point represents theattenuation effect resulting when the impedance of thecapacitor equals the resistance of the resistor.The equivalent multiplying factor for -3 dB is .707,i.e., a signal attenuated <strong>by</strong> 3 dB will be .707 times theoriginal in level. Ohms law tells us that if the voltage ismultiplied <strong>by</strong> .707, then the current will also be multiplied<strong>by</strong> .707. <strong>Power</strong> is calculated <strong>by</strong> multiplying voltagetimes current. Therefore, a voltage multiplied <strong>by</strong> .707,and a current multiplied <strong>by</strong> .707, equals 0.5 power. Sothe -3 dB points represent the half-power point — auseful reference.Lastly, Figure 9 shows the flat amplitude responseresulting from summing the LF and HF outputs together.This is called constant voltage, since the resultof adding the two output voltages together equalsa constant. The 1st-order case is ideal in that constantpower also results. Constant-power refers to thesummed power response for each loudspeaker driveroperating at the crossover frequency. This, too, resultsin a constant. Since each driver operates at half-powerat the crossover frequency, their sum equals one—orunity, a constant.1st-Order Phase ResponseMuch is learned <strong>by</strong> examining the phase shift behavior(Figure 10) of the 1st-order circuit. The upper curve isthe HF output and the lower curve is the LF output.The HF curve starts at +90° phase shift at DC, reducesto +45° at the crossover frequency and then levels outat 0° for high frequencies. The LF curve starts with 0ophase shift at DC, has -45° at the crossover frequencyand levels out at -90° for high frequencies.Because of its reactive (energy storing) nature eachcapacitor in a circuit contributes 90° of phase shift,either positive or negative depending upon its application.Since the HF section places the capacitor directlyin the signal path, this circuit starts out with +90°phase shift. This is called phase lead. The LF section,which starts out with 0° and eventually becomes -90° iscalled phase lag.Examination of Figure 10 allows us to formulate anew rule: each order, or degree, of a crossover networkcontributes ±45° of phase shift at the crossoverfrequency (positive for the HF output and negative forthe LF output).Figure 9. 1st-order amplitude response.Figure 10. 1st-order phase response.<strong>Linkwitz</strong>-<strong>Riley</strong>-
Figure 11. 1st-order group delay response.Figure 12. 1st-order transient response.Once again, Figure 10 shows the idealized natureof the 1st-order case. Here the result of summing theoutputs together produces 0° phase shift, which is tosay that the summed amplitude and phase shift of a1st-order crossover is equivalent to a piece of wire.1st-Order Group Delay ResponseWe shall return to our rules shortly, but first theconcept of group delay needs to be introduced. Groupdelay is the term given to the ratio of an incrementalchange in phase shift divided <strong>by</strong> the associated incrementalchange in frequency (from calculus, this is thefirst-derivative). The units for group delay are seconds.If the phase shift is linear, i.e., a constant rate of changeper frequency step, then the incremental ratio (first-derivative)will be constant. We therefore refer to a circuitwith linear phase shift as having constant group delay.Group delay is a useful figure of merit for identifyinglinear phase circuits. Figure 11 shows the group delayresponse for the Figure 8 1st-order crossover circuit.Constant group delay extends out to the crossoverregion where it gradually rolls off (both outputs areidentical). The summed response is, again, that of apiece of wire.The importance of constant group delay is the abilityto predict the behavior of the LF output step response.A circuit with constant group delay (linear phase shift)shows no overshoot or associated damping time to asudden change (step) in input level (Figure 12). Thecircuit reacts smoothly to the sudden change <strong>by</strong> risingsteadily to meet the new level. It does not go beyondthe new level and require time to settle back. We alsorefer to the step response as the transient response ofthe circuit. The transient response of the summed outputsis perfect since their sum is perfectly equal to one.For clarity purposes normally only the step responseof the LF network is shown. Nothing is learned <strong>by</strong>examining the step response of the HF network. A stepresponse represents a transition from one DC level toanother DC level, in this case, from -1 volt to +1 volt.A HF network, <strong>by</strong> definition, does not pass DC (neitherdoes a loudspeaker), so nothing particularly relevantis learned <strong>by</strong> examining its step response. To illustratethis, Figure 12 shows the HF step response. It beginsand ends with zero output since it cannot pass DC. Thesharp edge of the input step, however, contains muchhigh frequency material, which the HF network passes.So, it begins at zero, passes the high frequencies as apulse, and returns to zero.The HF and LF outputs are the exact complement ofeach other. Their sum equals the input step exactly asseen in Figure 12. Still, we learn everything we need toknow <strong>by</strong> examining only the LF step response; lookingfor overshoot and ringing. From now on, just the LFoutput is shown.<strong>Linkwitz</strong>-<strong>Riley</strong>-
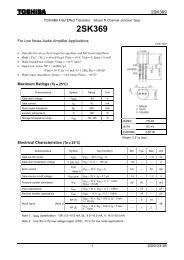
a) 1st-order(6 dB/oct)b) 2nd-order(12 dB/oct)c) 3rd-order(18 dB/oct)d) 4th-order(24 dB/oct)Figure 13. 1st-order vector and 2nd-, 3rd- and 4th-order Butterworth vector diagrams.Vector DiagramsA vector is a graphical thing (now we’re getting technical)with magnitude and direction. We can use vectorsto produce diagrams representing the instantaneousphase shift and amplitude behavior of electrical circuits.In essence, we freeze the circuit for a moment oftime to examine complex relationships.We shall now apply our two rules to produce avector diagram showing the relative phase shift andamplitude performance for the 1st-order crossovernetwork at the single crossover frequency (Figure 13a).By convention, 0° points right, +90° points up, -90°points down, and ±180° points left. From Figures 9 &10 we know the HF output amplitude is -3 dB with +45°of phase shift at 1 kHz, and the LF output is -3 dB with-45° phase shift. Figure 13a represents the vectors asbeing .707 long (relative to a normalized unity vector)and rotated up and down 45°. This shows us the relativephase difference between the two outputs equals 90°.Next we do vector addition to show the summedresults. Vector addition involves nothing more complexthan mentally moving one of the vectors to theend of the other and connecting the center to this newend point (constructing a parallelogram). Doing this,results in a new vector with a length equal to 1 and anangle of 0°. This tells us the recombined outputs of theHF and LF networks produce constant voltage (i.e., avector equal to 1), and is in phase with the original inputof the circuit (i.e., a vector with 0° phase rotation).The 1st-order case is ideal when summed. It yields apiece of wire. Since the responses are the exact mirrorimages of each other, they cancel when summed,thus behaving as if neither was there in the first place.Unfortunately, all optimized higher order versions yieldflat voltage/power response, group delay or phase shift,but not all at once. Hence, the existence of differentalignments and resultant compromises.Comparing Butterworth &<strong>Linkwitz</strong>-<strong>Riley</strong> AlignmentsButterworth AlignmentThere are many types of crossover alignments or filters(most named after mathematicians). Each displays aunique amplitude characteristic throughout the passband.Of these, only Butterworth filters have an absolutelyflat amplitude response. For this reason, Butterworthfilters are popular for crossover use. Butterworthfilters obey our two rules, so we can diagram them forthe 2nd, 3rd and 4th-order cases (Figures 13b-13d).The 2nd-order case has ±90° phase shift as shown. Thisresults in the outputs being 180° out of phase. Vectoraddition for this case produces a zero length vector, orcomplete cancellation. The popular way around this isto reverse the wiring on one of the drivers (or, if available,electronically inverting the phase at the crossover).This produces a resultant vector 90° out of phasewith the input and 3 dB (1.414 equals +3 dB) longer.This means there will be a 3 dB amplitude bump at thecrossover region for the combined signals.The 3rd-order Butterworth case (Figure 13c) mimicsthe 1st-order case at the crossover frequency, exceptrotated 180°. Hence, we see the HF vector rotated up135° (3 x 45°) and the LF vector rotated down the sameamount. The phase shift between outputs is still 90°.The resultant is constant voltage (unity) but 180° outof-phasewith the input.The 4th-order Butterworth diagram (Figure 13d)shows the HF vector rotated up 180° and the LF vectorrotated down the same amount. The phase differencebetween outputs is now zero, but the resultant is +3 dBand 180° out-of-phase with the input. So, the 4th-orderand the inverted phase 2nd-order produce 3 dB bumpsat the crossover frequency.<strong>Linkwitz</strong>-<strong>Riley</strong>-
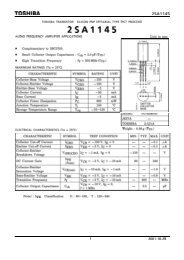
a) 2nd-order LR-2(12 dB/oct)b) 4th-order LR-4(24 dB/oct)c) 8th-order LR-8(48 dB/oct)Figure 14. <strong>Linkwitz</strong>-<strong>Riley</strong> vector diagrams for 2nd- to 8th-order cases.<strong>Linkwitz</strong>-<strong>Riley</strong> AlignmentTwo things characterize a <strong>Linkwitz</strong>-<strong>Riley</strong> alignment:1. In-phase outputs (0° between outputs) at all frequencies(not just at the crossover frequency as popularlybelieved <strong>by</strong> some).2. Constant voltage (the outputs sum to unity at allfrequencies).As discussed earlier <strong>Linkwitz</strong>-<strong>Riley</strong> in-phase outputssolve one troublesome aspect of crossover design. Theacoustic lobe resulting from both loudspeakers reproducingthe same frequency (the crossover frequency)is always on-axis (not tilted up or down) and has nopeaking. This is called zero lobing error. In order forthis to be true, however, both drivers must be in correcttime alignment, i.e., their acoustic centers must liein the same plane (or electrically put into equivalentalignment <strong>by</strong> adding time delay to one loudspeaker).Failure to time align the loudspeakers defeats this zerolobing error aspect. (The lobe tilts toward the laggingloudspeaker.)Examination of Figure 13 shows that the 2nd-order(inverted) and 4th-order Butterworth examples satisfycondition 1, but fail condition 2 since they exhibit a 3dB peak. So, if a way can be found to make the amplitudesat the crossover point -6 dB instead of -3 dB,then the vector lengths would equal 0.5 (-6 dB) insteadof .707 (-3 dB) and sum to unity — and we would have a<strong>Linkwitz</strong>-<strong>Riley</strong> crossover.Russ <strong>Riley</strong> suggested cascading (putting in series)two Butterworth filters to create the desired -6 dBcrossover points (since each contributes -3 dB). Voila!<strong>Linkwitz</strong>-<strong>Riley</strong> alignments were born.Taken to its most general extremes, cascading anyorder Butterworth filter produces 2x that order <strong>Linkwitz</strong>-<strong>Riley</strong>.Hence, cascading two 1st-order circuits producesa 2nd-order <strong>Linkwitz</strong>-<strong>Riley</strong> (LR-2); cascading two2nd-order Butterworth filters creates a LR-4 design;cascading two 3rd-order Butterworth filters gives a LR-6, and so on. (Starting with LR-2, every other solutionrequires inverting one output. That is, LR-2 and LR-6need inverting, while LR-4 and LR-8 do not.)LR-2, Transient Perfect 2nd-Order CrossoverAs an example of this process, let’s examine a LR-2 design.Referring to Figure 8 all that is required is to adda buffer amplifier (to avoid interaction between cascadedfilter components) to each of these two outputs andthen add another resistor/capacitor network identicalto the first. We now have a 2nd-order <strong>Linkwitz</strong>-<strong>Riley</strong>crossover.The new vector diagram looks like Figure 14a. Eachvector is .5 long (from the fact that each 1st-orderreduces <strong>by</strong> 0.707, and .707 x .707 = .5) with phase anglesof ±90°. Since the phase difference equals 180°, we invertone before adding and wind up with a unity vector90° out of phase with the original.Figure 15 shows the amplitude response. The crossoverpoint is located at -6 dB and the slopes are 12 dB/octave (40 dB/decade). The summed response is perfectlyflat. Figure 16 shows the phase response. At thecrossover frequency we see the HF output (upper trace)has +90° phase shift, while the LF output (lower trace)has -90° phase shift, for a total phase difference of 180°.Invert one before summing and the result is identicalto the LF output.These results differ from the 1st-order case in thatthe summed results do not yield unity (a piece of wire),but instead create an all-pass network. (An all-passnetwork is characterized <strong>by</strong> having a flat amplituderesponse combined with a smoothly changing phaseresponse.) This illustrates Garde’s [10] famous work.<strong>Linkwitz</strong>-<strong>Riley</strong>-10
Figure 15. LR-2 amplitude responseFigure 17. LR-2 group delayCascading two linear phase circuits results in linearphase, as shown <strong>by</strong> the constant group delay plots (allthree identical) of Figure 17. And constant group delaygives the transient perfect LF step response shown inFigure 18.LR-4 and LR-8 AlignmentsLooking back to Figure 14b. we see the vector diagramsfor 4th and 8th-order <strong>Linkwitz</strong>-<strong>Riley</strong> designs. The LR-4design shows the resultant vector is unity but 180° outof phase with the input at the crossover frequency.Cascading two 4th-order Butterworth filters resultsin an 8th-order <strong>Linkwitz</strong>-<strong>Riley</strong> design. Figure 14c.shows the vector diagram for the LR-8 case. Here, wesee the phase shift for each output undergoes 360° rotationreturning to where it began. The resultant vectoris back in phase with the original input signal. So, notonly are the outputs in phase with each other (for allfrequencies), they are also in phase with the input (atthe crossover frequency).8th-Order ComparisonA LR-8 design exhibits slopes of 48 dB/octave, or 160dB/decade. Figure 19 shows this performance characteristiccompared with the LR-4, 4th-order case forreference. As expected, the LR-4 is 80 dB down onedecade away from the corner frequency, while the LR-8is twice that, or 160 dB down. Of interest here, are thepotential benefits of narrowing the crossover region <strong>by</strong>using a LR-8 alignment.Figure 16. LR-2 phase responseFigure 18. LR-2 transient response<strong>Linkwitz</strong>-<strong>Riley</strong>-11
Figure 19. LR-4 and LR-8 slopesFigure 20. LR-4 and LR-8 phase responseFigure 21 magnifies the responses shown in Figure19 to reveal a clearer picture of the narrower crossoverregion, as well as showing the flat summed responses.(The slight difference in summed amplitudes at thecrossover frequency is due to a slight gain differencebetween the two circuits.) The critical crossover regionfor the LR-8 case is one-half of what it is for the LR-4case. The exact definition of where the crossover regionbegins and ends is ambiguous, but, <strong>by</strong> whatever definition,the region has been halved.As an example of this, a very conservative definitionmight be where the responses are 1 dB down fromtheir respective passbands. We would then refer to thecrossover region as extending from the -1 dB point onthe low-pass response to the -1 dB point on the highpassresponse. For LR-8, these points are 769 Hz and1301 Hz respectively, yielding a crossover region only¾-octave wide. As a comparative reference, the LR-4case yields -1 dB points at 591 Hz and 1691 Hz, for a1.5-octave wide region.For the LR-8 case, it is interesting to note that the-1 dB point on the low-pass curve corresponds almostexactly to the -20 dB point on the high-pass curve(the exact points occur at 760 Hz and 1316 Hz). So ifyou want to define the region as where the response isdown 20 dB, you get the same answer. The entire regionfor the LR-8 case is ¾-octave wide, or it is one-halfthis number for each driver. That is, the loudspeakerdriver (referred to as ‘driver’ from now on) has to bewell behaved for only about 0.4-octave beyond thecrossover point. This compares with the 4th-order casewhere the same driver must behave for 0.8-octave.<strong>Linkwitz</strong>-<strong>Riley</strong>-12The above is quite conservative. If other referencepoints are used, say, the -3 dB points (895 Hz & 1117Hz), then the LR-8 crossover region is just ⅓-octavewide, and drivers only have to stay linear for 1/6-octave.(1/6-octave away from the crossover frequency thedrive signal is attenuated <strong>by</strong> 12 dB, so the output driveris operating at about 1/16 power.)The extremely steep slopes offer greater driver protectionand linear operation. Beyond the driver’s linearlimits all frequencies attenuate so quickly that mostnonlinearities and interaction ceases being significant.Because of this, the driver need not be as well behavedoutside the crossover frequency. It is not required to reproducefrequencies it was not designed for. For similarreasons, power handling capability can be improved forHF drivers as well. And this narrower crossover regionlessens the need for precise driver time alignment sincethe affected spectrum is so small.The caveat, though, is an increased difficulty indesigning good systems with sharp slopes. The loudspeakersinvolved have differing transient responses,polar patterns and power responses. This means thesystem designer must know the driver characteristicsthoroughly. Ironically, sometimes loudspeaker overlaphelps the system blend better even when on-axis amplituderesponse is flat.LR-8 Phase ResponseFigure 20 shows the respective phase response for LR-4(upper trace) and LR-8 (lower trace) designs. As predicted<strong>by</strong> the vector diagram in Figure 14b, the LR-4case has 180° (4 x 45°) of phase shift at the crossover
Figure 21. LR-4 and LR-8 slopes magnifiedFigure 22. LR-4 and LR-8 transient responsefrequency. Thus, the output signal is out-of-phase withthe input signal at the crossover frequency for the LR-4case. Both outputs are in-phase with each other, butout-of-phase with the input.The LR-8 design eliminates this out-of-phase condition<strong>by</strong> bringing the outputs back in sync with theinput signal at the crossover frequency. The lower traceshows the 360° phase shift for the LR-8 alignment.LR-8 Transient ResponseButterworth functions do not have linear phase shiftand consequently do not exhibit constant group delay.(First-order networks are not classified as Butterworth.)Since <strong>Linkwitz</strong>-<strong>Riley</strong> designs (higher than LR-2) arecascaded Butterworth, they also do not have constantgroup delay.Group delay is just a measure of the non-linearityof phase shift. A direct function of non-linear phasebehavior is overshoot and damping time for a stepresponse. The transient behavior of all <strong>Linkwitz</strong>-<strong>Riley</strong>designs (greater than 2nd-order) is classic Butterworthin nature. That is, the filters exhibit slight overshootwhen responding to a step response, and take time todamp down.Figure 22 compares LR-8 and LR-4 designs andshows the greater overshoot and damping time for the8th-order case. The overshoot is 15% for the LR-4 caseand twice that, or about 30%, for the LR-8 case. Asexpected, the LR-8 design takes about twice as long todamp down. The initial rise-time differences are due tothe group delay value differences.Is It Audible?The conservative answer says it is not audible to theoverwhelming majority of audio professionals. Underlaboratory conditions, some people hear a difference onnon-musical tones (clicks and square waves).The practical answer says it is not audible to anyonefor real sound systems reproducing real audio signals.<strong>Linkwitz</strong>-<strong>Riley</strong> <strong>Power</strong> Response<strong>Linkwitz</strong>-<strong>Riley</strong> alignments produce constant voltageresponse (voltage vectors sum to unity) at the crossoverfrequency, but they may produce constant power. Atthe crossover frequency, each voltage output is half ofnormal. This produces half the normal current intothe loudspeakers. Since power is the product of voltagetimes current, the power is one-quarter of normal.Considering a simple two-way system, the combinedtotal power at the crossover frequency will be half ofnormal (one-quarter from each driver), producing a dipof 3 dB at the crossover frequency in the overall powerresponse, provided there is no additional phase shiftcontributed <strong>by</strong> the drivers themselves — such is neverthe case.The power response of loudspeakers with noncoincidentdrivers is a complex problem. See the Vanderkooyand Lipshitz [11] study for complete details.<strong>Linkwitz</strong>-<strong>Riley</strong>-13
References1. S. H. <strong>Linkwitz</strong> “Active Crossover Networks for Non-coincident Drivers,” J. Audio Eng. Soc., vol. 24, pp. 2-8 (Jan/Feb 1976).2. D. Bohn. “A Fourth Order State Variable Filter for <strong>Linkwitz</strong>-<strong>Riley</strong> Active Crossover Designs,” presented at the74th Convention of the Audio Engineering Society, New York, Oct. 9-12, 1983, preprint no. 2011.3. S. P. Lipshitz and J. Vanderkooy, “A Family of Linear-Phase Crossover Networks of High Slope Derived <strong>by</strong> TimeDelay,” J. Audio Eng. Soc., vol. 31, pp. 2-20 (Jan/Feb 1983).4. R. H. Small, “Constant-Voltage Crossover Network Design,” J. Audio Eng. Soc., vol. 19, pp. 12-19 (Jan 1971).5. J.R. Ashley and A. L. Kaminsky. “Active and Passive Filters as Loudspeaker Crossover Networks,” J. Audio Eng.Soc., vol. 19. pp. 494-502 (June 1971).6. B. B. Bauer, “Audibility of Phase Shift,” Wireless World, (Apr. 1974).7. S. P. Lipshitz, M. Pocock, and J. Vanderkooy. “On the Audibility of Midrange Phase Distortion in Audio Systems,”J. Audio Eng. Soc., vol. 30, pp. 580-595 (Sep 1982).8. R. Lee. “Is Linear Phase Worthwhile,” presented at the 68th Convention of the Audio Engineering Society,Hamburg, Mar 17-20, 1981, preprint no. 1732.9. H. Suzuke, S. Morita and T. Shindo, “On the Perception of Phase Distortion,” J. Audio Eng. Soc., vol. 28, no. 9,pp. 570-574 (Sep 1980).10. P. Garde, ‘All-Pass Crossover Systems,’ J. Audio Eng. Soc., vol. 28, pp. 575-584 (Sep. 1980).11. J. Vanderkooy & S.P. Lipshitz, “<strong>Power</strong> Response of Loudspeakers with Noncoincident Drivers — The Influenceof Crossover Design,” J. Audio Eng. Soc., Vol. 34, No. 4, pp. 236-244 (Apr. 1986).©Rane Corporation 10802 47th Ave. W., Mukilteo WA 98275-5098 USA TEL 425-355-6000 FAX 425-347-7757 WEB www.rane.com<strong>Linkwitz</strong>-<strong>Riley</strong>-14