- Page 1 and 2:
L'' . ' '(SZilt6i) (SX156i).'Advanc
- Page 3:
This edition differs from the previ
- Page 6 and 7:
ContentsVectors and Matrices1.1 Int
- Page 8 and 9:
3.6 Combined Operations 183*3.7 Cur
- Page 10 and 11:
*6.24 Principal Value of Improper I
- Page 12 and 13:
Case of Two Particles 662Case of N
- Page 14 and 15:
2 Advanced Calculus, Fifth EditionF
- Page 16 and 17:
4 Advanced Calculus, Fifth EditionF
- Page 18 and 19:
6 Advanced Calculus. Fifth Editiona
- Page 20 and 21:
Advanced Calculus. Fifth EditionFig
- Page 22 and 23:
10 Advanced Calculus. Fifth Edition
- Page 24 and 25:
12 Advanced Calculus, Fifth Edition
- Page 26 and 27:
14 Advanced Calculus, Fifth Edition
- Page 28 and 29:
16 Advanced Calculus, Fifth Edition
- Page 30 and 31:
18 Advanced Calculus, Fifth Edition
- Page 32 and 33:
20 Advanced Calculus, Fifth Edition
- Page 34 and 35:
22 Advanced Calculus, Fifth Edition
- Page 36 and 37:
24 Advanced Calculus, Fifth Edition
- Page 38 and 39: 26 Advanced Calculus, Fifth Edition
- Page 40 and 41: 28 Advanced Calculus. Fifth Edition
- Page 42 and 43: 30 Advanced Calculus, Fifth Edition
- Page 44 and 45: 32 Advanced Calculus, Fifth Edition
- Page 46 and 47: 34 Advanced Calculus, Fifth Edition
- Page 48 and 49: 36 Advanced Calculus. Fifth Edition
- Page 50 and 51: Advanced Calculus. Fifth Editionhas
- Page 52 and 53: 40 Advanced Calculus, Fifth Edition
- Page 54 and 55: 42 Advanced Calculus, Fifth Edition
- Page 56 and 57: 44 Advanced Calculus, Fifth Edition
- Page 58 and 59: 46 Advanced Calculus, Fifth Edition
- Page 60 and 61: 48 Advanced Calculus, Fifth Edition
- Page 62 and 63: 50 Advanced Calculus, Fifth Edition
- Page 64 and 65: 52 Advanced Calculus, Fifth Edition
- Page 66 and 67: Advanced Calculus, Fifth Edition8.
- Page 68 and 69: 56 Advanced Calculus, Fifth Edition
- Page 70 and 71: 58 Advanced Calculus, Fifth Edition
- Page 72 and 73: 60 Advanced Calculus, Fifth Edition
- Page 74 and 75: Advanced Calculus, Fifth EditionBy
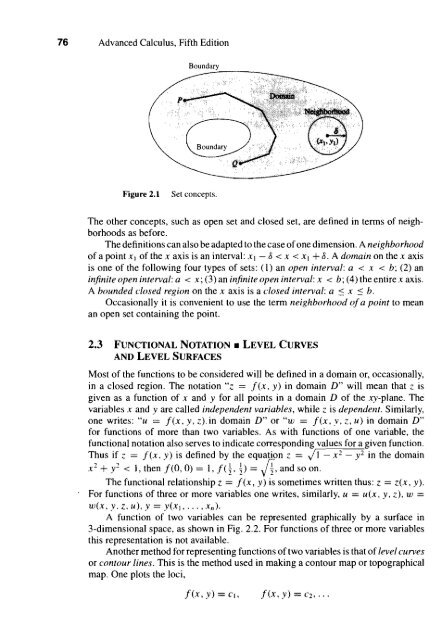
- Page 76 and 77: 64 Advanced Calculus, Fifth Edition
- Page 78 and 79: 66 Advanced Calculus, Fifth Edition
- Page 80 and 81: 68 Advanced Calculus. Fifth Edition
- Page 82 and 83: 70 Advanced Calculus, Fifth Edition
- Page 85 and 86: Differential Calculusof Functionsof
- Page 87: Chapter 2 Differential Calculus of
- Page 91 and 92: Chapter 2 Differential Calculus of
- Page 93 and 94: Chapter 2 Differential Calculus of
- Page 95 and 96: Chapter 2 Differential Calculus of
- Page 97 and 98: 86 Advanced Calculus. Fifth Edition
- Page 99 and 100: Chapter 2 Differential Calculus of
- Page 101 and 102: Chapter 2 Differential Calculus of
- Page 103 and 104: Chapter 2 Differential Calculus of
- Page 105 and 106: Chapter 2 Differential Calculus of
- Page 107 and 108: Chapter 2 Differential Calculus of
- Page 109 and 110: Chapter 2 Differential Calculus of
- Page 111 and 112: Chapter 2 Differential Calculus of
- Page 113 and 114: Chapter 2 Differential Calculus of
- Page 115 and 116: Chapter 2 Differential Calculus of
- Page 117 and 118: Chapter 2 Differential Calculus of
- Page 119 and 120: Chapter 2 Differential Calculus of
- Page 121 and 122: Chapter 2 Differential Calculus of
- Page 123 and 124: Chapter 2 Differential Calculus of
- Page 125 and 126: Chapter 2 Differential Calculus of
- Page 127 and 128: Chapter 2 Differential Calculus of
- Page 129 and 130: Chapter 2 Differential Calculus of
- Page 131 and 132: Chapter 2 Differential Calculus of
- Page 133 and 134: PROBLEMSChapter 2 Differential Calc
- Page 135 and 136: Chapter 2 Differential Calculus of
- Page 137 and 138: Chapter 2 Differential Calculus of
- Page 139 and 140:
Chapter 2 Differential Calculus of
- Page 141 and 142:
Chapter 2 Differential Calculus of
- Page 143 and 144:
Chapter 2 Differential Calculus of
- Page 145 and 146:
Chapter 2 Differential Calculus of
- Page 147 and 148:
Chapter 2 Differential ~alculus of
- Page 149 and 150:
defined analogously:Chapter 2 Diffe
- Page 151 and 152:
Chapter 2 Differential Calculus of
- Page 153 and 154:
Chapter 2 Differential Calculus of
- Page 155 and 156:
Chapter 2 Differential Calculus of
- Page 157 and 158:
Chapter 2 Differential Calculus of
- Page 159 and 160:
Chapter 2 Differential Calculus of
- Page 161 and 162:
Chapter 2 Differential Calculus of
- Page 163 and 164:
Chapter 2 Differential Calculus of
- Page 165 and 166:
Chapter 2 Differential Calculus of
- Page 167 and 168:
Chapter 2 Differential Calculus of
- Page 169 and 170:
Chapter 2 Differential Calculus of
- Page 171 and 172:
Chapter 2 Differential Calculus of
- Page 173 and 174:
Chapter 2 Differential Calculus of
- Page 175 and 176:
Chapter 2 Differential Calculus of
- Page 177 and 178:
Chapter 2 Differential Calculus of
- Page 179 and 180:
Chapter 2 Differential Calculus of
- Page 181 and 182:
Chapter 2 Differential Calculus of
- Page 183 and 184:
Chapter 2 Differential Calculus of
- Page 185:
Chapter 2 Differential Calculus of
- Page 188 and 189:
176 Advanced Calculus, Fifth Editio
- Page 190 and 191:
magnitudeand the force is inversely
- Page 192 and 193:
180 Advanced Calculus, Fifth Editio
- Page 194 and 195:
i, -A f1 82 Advanced Calculus, Fift
- Page 196 and 197:
2&Advanced Calculus, Fifth EditionT
- Page 198 and 199:
186 Advanced Calculus, Fifth Editio
- Page 200 and 201:
188 Advanced Calculus, Fifth Editio
- Page 202 and 203:
190 Advanced Calculus, Fifth Editio
- Page 204 and 205:
Advanced Calculus, Fifth Edition: s
- Page 206 and 207:
TI1 194 Advanced Calculus, Fifth Ed
- Page 208 and 209:
196 Advanced Calculus. Fifth Editio
- Page 210 and 211:
198 Advanced Calculus, Fifth Editio
- Page 212 and 213:
200 Advanced Calculus, Fifth Editio
- Page 214 and 215:
f4202 Advanced Calculus, Fifth Edit
- Page 216 and 217:
204 Advanced Calculus, Fifth Editio
- Page 218 and 219:
206 Advanced Calculus, Fifth Editio
- Page 220 and 221:
i208 Advanced Calculus, Fifth Editi
- Page 222 and 223:
210 Advanced Calculus, Fifth Editio
- Page 224 and 225:
21 2 Advanced Calculus, Fifth Editi
- Page 226 and 227:
21 4 Advanced Calculus, Fifth Editi
- Page 228 and 229:
21 6 Advanced Calculus, Fifth Editi
- Page 230 and 231:
*I. 421 8 Advanced Calculus, Fifth
- Page 232 and 233:
220 Advanced Calculus, Fifth Editio
- Page 234 and 235:
222 Advanced Calculus, Fifth Editio
- Page 236 and 237:
224 Advanced Calculus, Fifth Editio
- Page 238 and 239:
226 Advanced Calculus, Fifth Editio
- Page 240 and 241:
228 Advanced Calculus, Fifth Editio
- Page 242 and 243:
230 Advanced Calculus, Fifth Editio
- Page 244 and 245:
232 Advanced Calculus, Fifth Editio
- Page 246 and 247:
, '234 Advanced Calculus, Fifth Edi
- Page 248 and 249:
236 Advanced Calculus, Fifth Editio
- Page 250 and 251:
238 Advanced Calculus, Fifth Editio
- Page 252 and 253:
240 Advanced Calculus, Fifth Editio
- Page 254 and 255:
242 Advanced Calculus, Fifth Editio
- Page 256 and 257:
244 Advanced Calculus, Fifth Editio
- Page 258 and 259:
246 Advanced Calculus, Fifth Editio
- Page 260 and 261:
248 Advanced Calculus, Fifth Editio
- Page 262 and 263:
250 Advanced Calculus, Fifth Editio
- Page 264 and 265:
252 Advanced Calculus, Fifth Editio
- Page 266 and 267:
254 Advanced Calculus, Fifth Editio
- Page 268 and 269:
256 Advanced Calculus. Fifth Editio
- Page 270 and 271:
258 Advanced Calculus, Fifth Editio
- Page 272 and 273:
260 Advanced Calculus, Fifth Editio
- Page 274 and 275:
262 Advanced Calculus, Fifth Editio
- Page 276 and 277:
Advanced Calculus, Fifth EditionFig
- Page 279 and 280:
Vector Integral CalculusPART I.TWO-
- Page 281 and 282:
Chapter 5 Vector Integral Calculus
- Page 283 and 284:
Chapter 5 Vector Integral Calculus
- Page 285 and 286:
Chapter 5 Vector Integral Calculus
- Page 287 and 288:
Chapter 5 Vector Integral Calculus
- Page 289 and 290:
Chapter 5 Vector Integral Calculus
- Page 291 and 292:
3. Evaluate the following line inte
- Page 293 and 294:
Chapter 5 Vector Integral Calculus
- Page 295 and 296:
Chapter 5 Vector Integral Calculus
- Page 297 and 298:
Chapter 5 Vector Integral Calculus
- Page 299 and 300:
5. Evaluate by Green's theorem:a) $
- Page 301 and 302:
Chapter 5 Vector Integral Calculus
- Page 303 and 304:
Chapter 5 Vector Integral Calculus
- Page 305 and 306:
Chapter 5 Vector Integral Calculus
- Page 307 and 308:
Chapter 5 Vector Integral Calculus
- Page 309 and 310:
Chapter 5 Vector Integral Calculus
- Page 311 and 312:
Chapter 5 Vector Integral Calculus
- Page 313 and 314:
Chapter 5 Vector Integral Calculus
- Page 315 and 316:
Chapter 5 Vector Integral Calculus
- Page 317 and 318:
Chapter 5 Vector Integral Calculus
- Page 319 and 320:
Chapter 5 Vector Integral Calculus
- Page 321 and 322:
Chapter 5 Vector Integral' Calculus
- Page 323 and 324:
Chapter 5 Vector Integral Calculus
- Page 325 and 326:
Chapter 5 Vector Integral Calculus
- Page 327 and 328:
Chapter 5 Vector Integral CalculusT
- Page 329 and 330:
Chapter 5 Vector Integral CalculusN
- Page 331 and 332:
Chapter 5 Vector Integral Calculusn
- Page 333 and 334:
Chapter 5 Vector Integral Calculus
- Page 335 and 336:
Chapter 5 Vector Integral CalculusF
- Page 337 and 338:
Chapter 5 Vector Integral Calculus
- Page 339 and 340:
Chapter 5 Vector Integral Calculus
- Page 341 and 342:
Chapter 5 Vector Integral Calculus
- Page 343 and 344:
Chapter 5 Vector Integral Calculus
- Page 345 and 346:
Green's theorem now givesChapter 5
- Page 347 and 348:
Chapter 5 Vector Integral Calculus
- Page 349 and 350:
Chapter 5 Vector Integral Calculus
- Page 351 and 352:
*5.15 PHYSICAL APPLICATIONSChapter
- Page 353 and 354:
Chapter 5 Vector Integral Calculus
- Page 355 and 356:
Chapter 5 Vector Integral Calculus
- Page 357 and 358:
Chapter 5 Vector Integral Calculus
- Page 359 and 360:
Chapter 5 Vector Integral Calculus
- Page 361 and 362:
Chapter 5 Vector Integral Calculus
- Page 363 and 364:
Chapter 5 Vector Integral Calculus
- Page 365 and 366:
Chapter 5 Vector Integral Calculus
- Page 367 and 368:
Chapter 5 Vector Integral Calculus
- Page 369 and 370:
Chapter 5 Vector Integral Calculus
- Page 371 and 372:
Chapter 5 Vector Integral Calculus
- Page 373 and 374:
Chapter 5 Vector Integral Calculus
- Page 375 and 376:
Chapter 5 Vector Integral Calculus
- Page 377 and 378:
Chapter 5 Vector Integral Calculus
- Page 379 and 380:
Chapter 5 Vector Integral Calculus
- Page 381 and 382:
Chapter 5 Vector Integral Calculus
- Page 383 and 384:
Chapter 5 Vector Integral Calculus
- Page 385 and 386:
Chapter 5 Vector Integral Calculus
- Page 387 and 388:
Infinite Series6.1 INTRODUCTIONAn i
- Page 389 and 390:
Chapter 6 Infinite Series 377These
- Page 391 and 392:
Chapter 6 Infinite Series 379If a s
- Page 393 and 394:
Chapter 6 Infinite Series 381Every
- Page 395 and 396:
Chapter 6 Infinite Series 383PROBLE
- Page 397 and 398:
Chapter 6 Infinite Series 385EXAMPL
- Page 399 and 400:
Chapter 6 Infinite Series 387If ELP
- Page 401 and 402:
Chapter 6 Infinite Seriesi ,Figure
- Page 403 and 404:
n Chapter 6 Infinite Series 391If L
- Page 405 and 406:
Chapter 6 Infinite Series 393of con
- Page 407 and 408:
EXAMPLE 8zz, 5. Again the ratio tes
- Page 409 and 410:
12. Determine convergence or diverg
- Page 411 and 412:
The theorem has a counterpart in te
- Page 413 and 414:
Chapter 6 Infinite Series 401Proof.
- Page 415 and 416:
Chapter 6 Infinite Series 403as alg
- Page 417 and 418:
Chapter 6 Infinite Series 405b) Sho
- Page 419 and 420:
at. Chapter 6 Infinite Series 407Fi
- Page 421 and 422:
Chapter 6 Infinite Series 409Furthe
- Page 423 and 424:
F; Chapter 6 .Infinite Series 41 1C
- Page 425 and 426:
Chapter 6 Infinite Series 41 3Figur
- Page 427 and 428:
for when x = $, the numerator Ixn 1
- Page 429 and 430:
EXAMPLE 1Ezl 5. Here the ratio test
- Page 431 and 432:
Chapter 6 Infinite Series 41 9Figur
- Page 433 and 434:
Chapter 6 Infinite Series 421This h
- Page 435 and 436:
. ,. Chapter 6 Infinite Series 423D
- Page 437 and 438:
, Chapter 6 Infinite Series 425by T
- Page 439 and 440:
Chapter 6 Infinite Series 427THEORE
- Page 441 and 442:
nL: Chapter 6 Infinite Series 429ha
- Page 443 and 444:
Chapter 6 Infinite Series 431the Ta
- Page 445 and 446:
I .Chapter 6 Infinite Series 433EXA
- Page 447 and 448:
I:I Chapter 6 Infinite Series 435An
- Page 449 and 450:
[Hint: Use induction. For n = 0 the
- Page 451 and 452:
Chapter 6 Infinite Series 439%Let z
- Page 453 and 454:
Chapter 6 Infinite Series 441is not
- Page 455 and 456:
Chapter 6 Infinite Series 443Figure
- Page 457 and 458:
Chapter 6 Infinite Series 445The th
- Page 459 and 460:
Chapter 6 Infinite Series 447d 2 =
- Page 461 and 462:
Chapter 6 Infinite Series 449THEORE
- Page 463 and 464:
Chapter 6 Infinite Series 451THEORE
- Page 465 and 466:
6Chapter 6 Infinite Series 453diver
- Page 467 and 468:
, .rJii' Chapter 6 Infinite SeriesE
- Page 469 and 470:
.nr~. Chapter 6 Infinite Series 457
- Page 471 and 472:
Chapter 6 Infinite Series 459Figure
- Page 473 and 474:
Chapter 6 Infinite Series 461b) Let
- Page 475 and 476:
Chapter 6 Infinite Series 463By ana
- Page 477 and 478:
Therefore R3 lies in some annulus h
- Page 479 and 480:
Fourier Series andOrthogonal Functi
- Page 481 and 482:
Chapter 7 Fourier Series and Orthog
- Page 483 and 484:
Chapter 7 Fourier Series and Orthog
- Page 485 and 486:
Chapter 7 Fourier Series and Orthog
- Page 487 and 488:
Chapter 7 Fourier Series and Orthog
- Page 489 and 490:
Chapter 7 Fourier Series and Orthog
- Page 491 and 492:
Chapter 7 Fourier Series and Orthog
- Page 493 and 494:
Chapter 7 Fourier Series and Orthog
- Page 495 and 496:
Chapter 7 Fourier Series and Orthog
- Page 497 and 498:
Chapter 7 Fourier Series and Orthog
- Page 499 and 500:
Chapter 7 Fourier Series and Orthog
- Page 501 and 502:
Chapter 7 Fourier Series and Orthog
- Page 503 and 504:
Chapter 7 Fourier Series and Orthog
- Page 505 and 506:
Chapter 7 Fourier Series and Orthog
- Page 507 and 508:
Chapter 7 Fourier Series and Orthog
- Page 509 and 510:
Chapter 7 Fourier Series and Orthog
- Page 511 and 512:
Chapter 7Fourier Series and Orthogo
- Page 513 and 514:
Chapter 7 Fourier Series and Orthog
- Page 515 and 516:
Chapter 7 Fourier Series and Orthog
- Page 517 and 518:
Chapter 7 Fourier Series and Orthog
- Page 519 and 520:
Chapter 7 Fourier Series and Orthog
- Page 521 and 522:
Chapter 7 Fourier Series and Orthog
- Page 523 and 524:
y the Schwarz inequality (7.46). By
- Page 525 and 526:
Chapter 7 Fourier Series and Orthog
- Page 527 and 528:
Chapter 7 Fourier Series and Orthog
- Page 529 and 530:
Chapter 7 Fourier Series and Orthog
- Page 531 and 532:
Chapter 7 Fourier Series and Orthog
- Page 533 and 534:
Chapter 7 Fourier Series and Orthog
- Page 535 and 536:
Chapter 7 Fourier Series and Orthog
- Page 537 and 538:
Chapter 7 Fourier Series and Orthog
- Page 539 and 540:
Chapter 7 Fourier Series and Orthog
- Page 541 and 542:
IiChapter 7 Fourier Series and Orth
- Page 543 and 544:
Functions of aComplex VariableWe as
- Page 545 and 546:
Chapter 8 Functions of a Complex Va
- Page 547 and 548:
TChapter 8 Functions of a Complex V
- Page 549 and 550:
Chapter 8 Functions of a Complex Va
- Page 551 and 552:
Chapter 8 Functions of a Complex Va
- Page 553 and 554:
Chapter 8 Functions of a Complex Va
- Page 555 and 556:
Chapter 8 Functions of a Complex Va
- Page 557 and 558:
Chapter 8 Functions of a Complex Va
- Page 559 and 560:
Chapter 8 Functions of a Complex Va
- Page 561 and 562:
PROBLEMSChapter 8 Functions of a Co
- Page 563 and 564:
Chapter 8 Functions of a Complex Va
- Page 565 and 566:
Chapter 8 Functions of a Complex Va
- Page 567 and 568:
Chapter 8 Functions of a Complex Va
- Page 569 and 570:
Chapter 8 Functions of a Complex Va
- Page 571 and 572:
2f 'c) J, zeZ dz on the line segmen
- Page 573 and 574:
Chapter 8 Functions of a Complex Va
- Page 575 and 576:
Chapter 8 Functions of a Complex Va
- Page 577 and 578:
Chapter 8 Functions of a Complex Va
- Page 579 and 580:
Chapter 8 Functions of a Complex Va
- Page 581 and 582:
Chapter 8 Functions of a Complex Va
- Page 583 and 584:
Chapter 8 Functions of a Complex Va
- Page 585 and 586:
Chapter 8 Functions of a Complex Va
- Page 587 and 588:
Chapter 8 Functions of a Complex Va
- Page 589 and 590:
Chapter 8 Functions of a Complex Va
- Page 591 and 592:
Rule IV could also be used, with A
- Page 593 and 594:
RULE V If f (z) has a zero of first
- Page 595 and 596:
Chapter 8 Functions of a Complex Va
- Page 597 and 598:
Chapter 8 Functions of a Complex Va
- Page 599 and 600:
Chapter 8 Functions of a Complex Va
- Page 601 and 602:
Chapter 8 Functions of a Complex Va
- Page 603 and 604:
+aJ 12. Evaluate the following inte
- Page 605 and 606:
Chapter 8 Functions of a Complex Va
- Page 607 and 608:
Chapter 8 Functions of a Complex Va
- Page 609 and 610:
Chapter 8 Functions of a Complex Va
- Page 611 and 612:
Chapter 8 Functions of a Complex Va
- Page 613 and 614:
Chapter 8 Functions of a Complex Va
- Page 615 and 616:
Chapter 8 Functions of a Complex Va
- Page 617 and 618:
Chapter 8 Functions of a Complex Va
- Page 619 and 620:
Chapter 8 Functions of a Complex Va
- Page 621 and 622:
Chapter 8 Functions of a Complex Va
- Page 623 and 624:
Chapter 8 Functions of a Complex Va
- Page 625 and 626:
Chapter 8 Functions of a Complex Va
- Page 627 and 628:
The function U is Airy's stress fun
- Page 629 and 630:
'Chapter 8 Functions of a Complex V
- Page 631 and 632:
Chapter 8 Functions of a Complex Va
- Page 633 and 634:
PassibleChapter 8 Functions of a Co
- Page 635 and 636:
C) the first quadrant of the w plan
- Page 637 and 638:
Ordinary DifferentialEquations9.1 D
- Page 639 and 640:
Chapter 9 Ordinary Differential Equ
- Page 641 and 642:
Chapter 9 Ordinary Differential Equ
- Page 643 and 644:
Chapter 9 Ordinary Differential Equ
- Page 645 and 646:
Chapter 9 Ordinary Differential Equ
- Page 647 and 648:
Chapter 9 Ordinary Differential Equ
- Page 649 and 650:
Chapter 9 Ordinary Differential Equ
- Page 651 and 652:
Chapter 9 Ordinary Differential Equ
- Page 653 and 654:
Chapter 9 Ordinary Differential Equ
- Page 655 and 656:
Chapter 9 Ordinary Differential Equ
- Page 657 and 658:
Here we make a change of variable,
- Page 659 and 660:
Chapter 9 Ordinary Differential Equ
- Page 661 and 662:
Chapter 9 Ordinary Differential Equ
- Page 663 and 664:
Chapter 9 Ordinary Differential Equ
- Page 665 and 666:
Chapter 9 Ordinary Differential Equ
- Page 667 and 668:
Chapter 9 Ordinary Differential Equ
- Page 669 and 670:
Chapter 9 Ordinary Differential Equ
- Page 671 and 672:
Partial DifferentialEquationsA part
- Page 673 and 674:
Chapter 10 Partial Differential Equ
- Page 675 and 676:
Chapter 10 Partial Differential Equ
- Page 677 and 678:
Chapter 10 Partial Differential Equ
- Page 679 and 680:
Chapter 10 Partial Differential Equ
- Page 681 and 682:
Chapter 10 Partial Differential Equ
- Page 683 and 684:
Chapter 10 Partial Differential Equ
- Page 685 and 686:
Chapter 10 Partial Differential Equ
- Page 687 and 688:
Chapter 10Partial Differential Equa
- Page 689 and 690:
Chapter 10 Partial Differential Equ
- Page 691 and 692:
Equations (10.66) and (10.67) then
- Page 693 and 694:
Chapter 10 Partial Differential Equ
- Page 695 and 696:
Chapter 10 Partial Differential Equ
- Page 697 and 698:
Chapter 10 Partial Differential Equ
- Page 699 and 700:
For t = 0 the series (10.99), if co
- Page 701 and 702:
These are easily solved for A and B
- Page 703 and 704:
Chapter 10 Partial Differential Equ
- Page 705 and 706:
Chapter 10 Partial Differential Equ
- Page 707 and 708:
Chapter 10 Partial Differential Equ
- Page 709 and 710:
Chapter 10 Partial Differential Equ
- Page 711 and 712:
Accordingly,Chapter 10 Partial Diff
- Page 713 and 714:
Chapter 10 Partial Differential Equ
- Page 715 and 716:
Chapter 10 Partial Differential Equ
- Page 717 and 718:
Chapter 10 Partial Differential Equ
- Page 719 and 720:
Chapter 10 Partial Differential Equ
- Page 721 and 722:
Chapter 10 Partial Differential Equ
- Page 723 and 724:
Chapter 10 Partial Differential Equ
- Page 726 and 727:
71 4 Advanced Calculus, Fifth Editi
- Page 728 and 729:
71 6 Advanced Calculus, Fifth Editi
- Page 730 and 731:
71 8 Advanced Calculus, Fifth Editi
- Page 732 and 733:
720 Advanced Calculus, Fifth Editio
- Page 734 and 735:
Advanced Calculus, Fifth EditionSec
- Page 736 and 737:
724 Advanced Calculus, Fifth Editio
- Page 738 and 739:
726 Advhhced Calculus, Fifth Editio
- Page 740 and 741:
728 Advanced Calculus, Fifth Editio
- Page 743:
Section 10.12, page 6941 - (-1)"1.
- Page 746 and 747:
734 Advanced Calculus, Fifth Editio
- Page 748 and 749:
736 Advanced Calculus, Fifth Editio
- Page 750 and 751:
738 Advanced Calculus, Fifth Editio
- Page 752 and 753:
740 Advanced Calculus, Fifth Editio