Short Lab Report Examples and Guide
Short Lab Report Examples and Guide
Short Lab Report Examples and Guide
- No tags were found...

You also want an ePaper? Increase the reach of your titles
YUMPU automatically turns print PDFs into web optimized ePapers that Google loves.
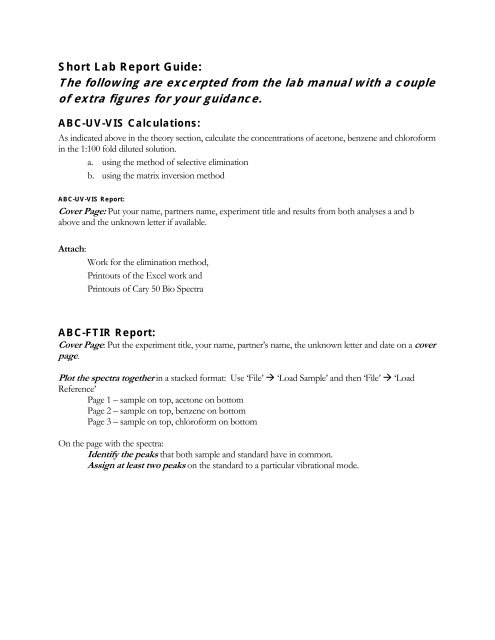
<strong>Short</strong> <strong>Lab</strong> <strong>Report</strong> <strong>Guide</strong>:The following are excerpted from the lab manual with a coupleof extra figures for your guidance.ABC-UV-VIS Calculations:As indicated above in the theory section, calculate the concentrations of acetone, benzene <strong>and</strong> chloroformin the 1:100 fold diluted solution.a. using the method of selective eliminationb. using the matrix inversion methodABC-UV-VIS <strong>Report</strong>:Cover Page: Put your name, partners name, experiment title <strong>and</strong> results from both analyses a <strong>and</strong> babove <strong>and</strong> the unknown letter if available.Attach:Work for the elimination method,Printouts of the Excel work <strong>and</strong>Printouts of Cary 50 Bio SpectraABC-FTIR <strong>Report</strong>:Cover Page: Put the experiment title, your name, partner’s name, the unknown letter <strong>and</strong> date on a coverpage.Plot the spectra together in a stacked format: Use ‘File’ ‘Load Sample’ <strong>and</strong> then ‘File’ ‘LoadReference’Page 1 – sample on top, acetone on bottomPage 2 – sample on top, benzene on bottomPage 3 – sample on top, chloroform on bottomOn the page with the spectra:Identify the peaks that both sample <strong>and</strong> st<strong>and</strong>ard have in common.Assign at least two peaks on the st<strong>and</strong>ard to a particular vibrational mode.
ABC-FTIR <strong>Report</strong>: Example of Spectra in Stacked Format with Peaks <strong>Lab</strong>eled.Benzene, neatAcetone, neatChloroform, neatAcetoneBenzeneChloroformCarbonyl C=0 stretch.ABC MixtureAliphatic C-H stretch.
ABC-GCMS <strong>Report</strong>:Cover page should have your name, your partner’s name, the date <strong>and</strong> your unknownletter.1. Calculate the concentrations of acetone, benzene <strong>and</strong> chloroform in themixture using the GC peak integrals, using appropriate internal st<strong>and</strong>ard <strong>and</strong>st<strong>and</strong>ard addition formalism. Show your work. (See next page for details.)2. Attach a chromatogram that shows all of the peaks <strong>and</strong> their integrals.3. Attach the MS <strong>and</strong> library match for each peak in ONE of thechromatograms.4. Indicate the likely structures for at least two ions in each mass spectrum.Fluorescence <strong>Report</strong>:Cover page should have your name, your partner’s name, the date <strong>and</strong> the experimenttitle.1. Experiment design. Write a sentence or short paragraph indicating theprocedure you devised to produce the 1 μM rhodamine 6G.2. Plots: (see example on next page) Plot both absorbance <strong>and</strong> fluorescencespectra on the same graph in Excel. Use the following guidelines (8 pts)a. Multiply the fluorescence spectrum values by a constant to give it roughlythe same amplitude as the absorption spectrum.b. Use two different line styles, (i.e. solid <strong>and</strong> dashed) but no symbols for theplots. Use only black <strong>and</strong> white.c. No background color.d. No grid lines unless these are necessary to convey information on theplots.e. Appropriate sig-figs on axis labels.f. Use a reasonable font size <strong>and</strong> a simple font like Arial, Helvetica or Times.g. Give the graph a minimalist appearance. Use the minimum amount of inknecessary to convey the information that you want to for the graph.h. Minimize wasted space in the graph.i. Include a legend indicating which plot is fluorescence <strong>and</strong> which isemission.3. Indicate the absorption <strong>and</strong> fluorescence emission processes using arrows of theappropriate relative lengths on a reproduction of the energy level diagram providedbelow.a. <strong>Lab</strong>el the axes on the diagram. (2 pts)b. Use arrows on the figure below to indicate:i. Initial state <strong>and</strong> final states describing the absorbance process. (2 pts)ii. Initial state <strong>and</strong> final state describing the laser excitation process. (1)iii. Initial state <strong>and</strong> final states describing the fluorescence emissionprocess. (2 pts)
4. Calculate the photon energy corresponding to the peak in the absorption <strong>and</strong>emission spectra in the units specified on the report page. (see example on nextpage)a. Answer values correct = +2 ptsb. Proper significant figures <strong>and</strong> units used = + 2 pts5. In a paragraph or two, explain why the absorption <strong>and</strong> emission wavelengths aredifferent <strong>and</strong> why the absorption <strong>and</strong> emission spectra look similar yet shifted onthe wavelength axis.Fluorescence Experiment: Example Plot.0.10.09λ MAX Abs = 528 nmλ MAX Em = 548 nmAbsorbance0.080.070.060.050.040.030.020.0101.0 µM Rhodamine 6G in water(1.0 cm path)EmissionAbsorbance-0.01400 450 500 550 600 650 700 750 800Wavelength (nm)Fluorescence Experiment : Example Calculations.eV := 1 nm := 10 − 9 ⋅mh := 6.626⋅10 − 34 ⋅J⋅sc 3.00⋅10 8 m:= ⋅sλ 528⋅10 − 9 c:= ⋅mν :=λE:= h⋅νE = 3.765× 10 − 19 J Photon energy in JE⋅ 6.02⋅10 23 − 1⋅mol2.266×10 5 J=molPhoton Energy in J/molE1.602⋅10 − 19 J⋅eV= 2.35eVPhoton Energy in electron volts1λ⋅10 − 7 cm⋅nm= 18939cm − 1Photon Energy in wavenumbers
Jablonski Diagram Page:λ MAX / nmJoulesJoules / molElectron volts (eV)Reciprocal cm (cm -1 )S1AbsorptionEmissionSo