Sound & Communications February 2009 Issue
Sound & Communications February 2009 Issue
Sound & Communications February 2009 Issue
- No tags were found...

You also want an ePaper? Increase the reach of your titles
YUMPU automatically turns print PDFs into web optimized ePapers that Google loves.
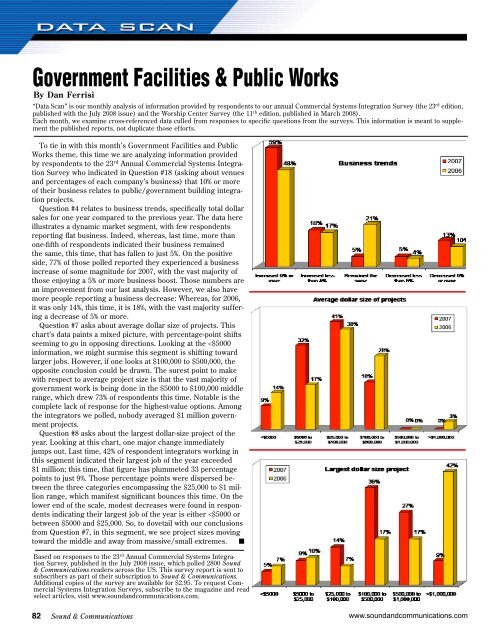
Government Facilities & Public WorksBy Dan Ferrisi“Data Scan” is our monthly analysis of information provided by respondents to our annual Commercial Systems Integration Survey (the 23 rd edition,published with the July 2008 issue) and the Worship Center Survey (the 11 th edition, published in March 2008).Each month, we examine cross-referenced data culled from responses to specific questions from the surveys. This information is meant to supplementthe published reports, not duplicate those efforts.To tie in with this month’s Government Facilities and PublicWorks theme, this time we are analyzing information providedby respondents to the 23 rd Annual Commercial Systems IntegrationSurvey who indicated in Question #18 (asking about venuesand percentages of each company’s business) that 10% or moreof their business relates to public/government building integrationprojects.Question #4 relates to business trends, specifically total dollarsales for one year compared to the previous year. The data hereillustrates a dynamic market segment, with few respondentsreporting flat business. Indeed, whereas, last time, more thanone-fifth of respondents indicated their business remainedthe same, this time, that has fallen to just 5%. On the positiveside, 77% of those polled reported they experienced a businessincrease of some magnitude for 2007, with the vast majority ofthose enjoying a 5% or more business boost. Those numbers arean improvement from our last analysis. However, we also havemore people reporting a business decrease: Whereas, for 2006,it was only 14%, this time, it is 18%, with the vast majority sufferinga decrease of 5% or more.Question #7 asks about average dollar size of projects. Thischart’s data paints a mixed picture, with percentage-point shiftsseeming to go in opposing directions. Looking at the