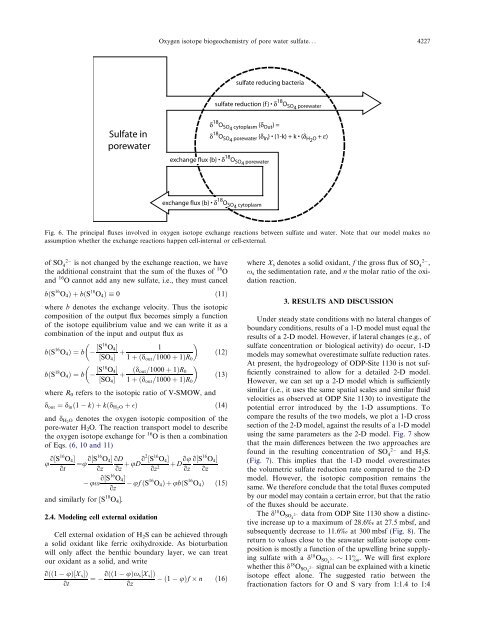
4226 U.G. Wortmann et al. / Geochimica et Cosmochimica Acta 71 (2007) 4221–4232gravimetrically (Böttcher et al., 2004). Pyrite-iron contentswere calculated from TRIS contents us<strong>in</strong>g <strong>the</strong> ideal stoichiometry<strong>of</strong> pyrite. Iron, leachable with buffered Na-dithionitesolution (Canfield, 1989) was also measured on twosamples (1130A-7-H3 and 1130A-21X-3) yield<strong>in</strong>g 0.05 and0.04 dry wt%, respectively.2.1. Reaction transport model formulationThe distribution <strong>of</strong> dissolved <strong>in</strong>terstitial <strong>water</strong> species affectedby diagenetic or biologically mediated conversionprocesses can be described as a process which <strong>in</strong>volvestransport by diffusion, transport by advection, and a consumptionor production function (Berner, 1964, 1980;Boudreau and Westrich, 1984; Boudreau, 1996). The standarddiagenetic equation (Berner, 1980) for a dissolved speciesdescribes <strong>the</strong> change <strong>of</strong> concentration with depth andtime as a function <strong>of</strong> diffusion, advection, porosity, andconsumption or production:oðuCÞot ¼zhoðuCÞo D B ozþ uðD i þ DÞ oCozozioðuxCÞozwhere: C is <strong>the</strong> concentration, D are diffusion coefficients todescribe diffusion due to bioturbation (D B ), diffusion due toirrigation (D i ) , and <strong>the</strong> molecular diffusion term D. Thesymbol u stands for <strong>the</strong> porosity, <strong>the</strong> advection velocity isdenoted x, time is expressed as t, and <strong>the</strong> reaction or productionfunction is termed f.In <strong>the</strong> follow<strong>in</strong>g, we will assume that <strong>the</strong>re is no bioturbation,no diffusive irrigation, and that porosity changesdowncore only as a result <strong>of</strong> compaction (for a more detaileddiscussion see, Berner, 1980; Wortmann, 2006; Chernyavskyand Wortmann, 2007). Thus we can simplify Eq.(5) and writeu oCot ¼ u oC oDoz oz þ uD o2 Coz þ D ou oC2 oz ozux oCozThese equations can now be used for <strong>in</strong>verse model<strong>in</strong>gto quantify <strong>the</strong> advection velocity, and <strong>the</strong> net volumetricSRR (f) as a function <strong>of</strong> depth (see e.g., Berg et al.,1998). The diffusion coefficient used for SO 42is computedas a function <strong>of</strong> shipboard measured temperature andporosity us<strong>in</strong>g <strong>the</strong> parameters given by Boudreau (1996).The reduction function describ<strong>in</strong>g <strong>the</strong> <strong>sulfate</strong> reduction isalmost identical to <strong>the</strong> one given by Wortmann (2006),but unlike <strong>the</strong> model used by Wortmann (2006) and Wortmannet al. (2001), here we <strong>in</strong>clude two major sedimentationevents <strong>in</strong> <strong>the</strong> upper 15 mbsf (H<strong>in</strong>e et al., 2002). Thesedimentation event was modeled as a depositional event<strong>of</strong> 5.72 m <strong>of</strong> sediment with<strong>in</strong> 200 years 10 ky ago, and a secondevent, deposit<strong>in</strong>g 9.36 m <strong>of</strong> sediment with<strong>in</strong> 300 yearsabout 200 years ago. These changes <strong>in</strong>crease <strong>the</strong> estimatedupwell<strong>in</strong>g velocity tw<strong>of</strong>old to 1.2 · 10 10 m/s, and allow usto successfully model <strong>the</strong> chemical pr<strong>of</strong>iles <strong>in</strong> <strong>the</strong> upper30 mbsf, which was not possible previously (see e.g., Wortmannet al., 2001; Wortmann, 2006). All model<strong>in</strong>g wasdone with REMAP (Chernyavsky and Wortmann, 2007)which was modified to <strong>in</strong>clude a module to calculate <strong>isotope</strong>exchange reactions.ufufð5Þð6Þ2.2. Model<strong>in</strong>g <strong>the</strong> k<strong>in</strong>etic oxygen <strong>isotope</strong> effects <strong>in</strong> <strong>sulfate</strong>In order to model k<strong>in</strong>etic oxygen <strong>isotope</strong> effects <strong>in</strong> <strong>sulfate</strong>we assume that this effect is proportional to <strong>the</strong> volumetricnet reduction rate f. We thus express <strong>the</strong> <strong>isotope</strong>effect similar to <strong>the</strong> approach <strong>of</strong> Jørgensen (1979), and writef ðS 16 O 4 Þ¼a½S 16 O 4 Š½SO 4 Šþða 1Þ½S 16 O 4 Š f ð7Þf ðS 18 ½S 18 O 4 ŠO 4 Þ¼a½SO 4 Š ða 1Þ½S 18 O 4 Š f ð8Þwhere values <strong>in</strong> square brackets denote concentrations.Note, that S 18 O is merely a notation to describe <strong>the</strong> concentration<strong>of</strong> 18 O <strong>in</strong> a <strong>sulfate</strong> molecule but <strong>in</strong> no way implies<strong>the</strong> existence <strong>of</strong> a molecule with 4 18 O <strong>isotope</strong>s (whichwould be extremely rare under natural conditions). Comb<strong>in</strong><strong>in</strong>gEqs. (5) and (7), we obta<strong>in</strong>u o½S16 O 4 Šot¼u o½S16 O 4 Š oDozux o½S16 O 4 Šozoz þ ½S 16 O 4 ŠuDo2 þ D ou o½S 16 O 4 Šoz 2 oz oza½S 16 O 4 Šu½SO 4 Šþða 1Þ½S 16 O 4 Š f ð9Þand similarly for 18 O. This allows us to describe <strong>the</strong> evolution<strong>of</strong> <strong>the</strong> d 18 O SO4 2 values as a function <strong>of</strong> depth, a and f.2.3. Model<strong>in</strong>g <strong>the</strong> oxygen <strong>isotope</strong> exchange between <strong>water</strong>and <strong>sulfate</strong>In <strong>the</strong> follow<strong>in</strong>g section, we do not dist<strong>in</strong>guish whe<strong>the</strong>rexchange reactions occur with<strong>in</strong> <strong>the</strong> cell or outside <strong>the</strong> cell.We fur<strong>the</strong>rmore assume that <strong>the</strong>re is no k<strong>in</strong>etic oxygen <strong>isotope</strong>fractionation dur<strong>in</strong>g microbial <strong>sulfate</strong> reduction, i.e.,that <strong>the</strong> d 18 O SO4 2 value depends only on <strong>the</strong> exchange reactionbetween <strong>water</strong> and SO 2 4.As equilibration reactions require zero net flow, we candescribe <strong>the</strong> oxygen <strong>isotope</strong> effect <strong>of</strong> <strong>the</strong> exchange reactionon <strong>the</strong> <strong>pore</strong>-<strong>water</strong> <strong>sulfate</strong> pool <strong>in</strong> terms <strong>of</strong> a closed loop.There, dissolved <strong>sulfate</strong> leaves <strong>the</strong> <strong>pore</strong>-<strong>water</strong> pool and entersa box where its oxygen <strong>isotope</strong> signature is modified by<strong>the</strong> exchange reaction, and afterwards returns back <strong>in</strong>to <strong>the</strong><strong>pore</strong>-<strong>water</strong> <strong>sulfate</strong> pool (Fig. 6). As before, we will only describe<strong>the</strong> volumetric exchange rates. Thus, <strong>the</strong> evolution <strong>of</strong><strong>the</strong> isotopic composition <strong>of</strong> <strong>the</strong> <strong>pore</strong>-<strong>water</strong> <strong>sulfate</strong> reservoircan be described <strong>in</strong> terms <strong>of</strong> <strong>the</strong> volumetric exchange flux b,<strong>the</strong> isotopic enrichment dur<strong>in</strong>g <strong>the</strong> exchange process and afactor k describ<strong>in</strong>g <strong>the</strong> extent <strong>of</strong> <strong>the</strong> exchange reaction.S<strong>in</strong>ce we assume that dissimilatory <strong>sulfate</strong> reduction hasno effect on <strong>the</strong> d 18 O SO4 2 value, <strong>the</strong> flux <strong>of</strong> 16 O and 18 Oisproportional to <strong>the</strong> <strong>in</strong>itial ratio <strong>of</strong> <strong>the</strong> given <strong>isotope</strong> to <strong>the</strong>total <strong>sulfate</strong> amountf ðS 16 O 4 Þ¼f ½S16 O 4 Šð10Þ½SO 4 Šand similarly for f( 18 O).We assume that <strong>the</strong>re is no <strong>isotope</strong> effect on <strong>the</strong>d 18 O SO4 2 composition for <strong>the</strong> flux associated with <strong>the</strong> exchangereaction and we can write this flux as be<strong>in</strong>g proportionalto <strong>the</strong> <strong>in</strong>itial ratio <strong>of</strong> <strong>the</strong> given <strong>isotope</strong> to <strong>the</strong> total<strong>sulfate</strong> amount as <strong>in</strong> Eq. (10). S<strong>in</strong>ce <strong>the</strong> total concentration
<strong>Oxygen</strong> <strong>isotope</strong> <strong>biogeochemistry</strong> <strong>of</strong> <strong>pore</strong> <strong>water</strong> <strong>sulfate</strong>... 4227<strong>sulfate</strong> reduc<strong>in</strong>g bacteria<strong>sulfate</strong> reduction {f } • δ 18 O SO4 <strong>pore</strong><strong>water</strong>Sulfate <strong>in</strong><strong>pore</strong><strong>water</strong>δ 18 O SO4 cytoplasm {δ Out }=δ 18 O SO4 <strong>pore</strong><strong>water</strong> {δ In } • (1-k) +k•(δ H 2 O + ε)exchange flux {b} • δ 18 O SO4 <strong>pore</strong><strong>water</strong>exchange flux {b} • δ 18 O SO4 cytoplasmFig. 6. The pr<strong>in</strong>cipal fluxes <strong>in</strong>volved <strong>in</strong> oxygen <strong>isotope</strong> exchange reactions between <strong>sulfate</strong> and <strong>water</strong>. Note that our model makes noassumption whe<strong>the</strong>r <strong>the</strong> exchange reactions happen cell-<strong>in</strong>ternal or cell-external.2<strong>of</strong> SO 4is not changed by <strong>the</strong> exchange reaction, we have<strong>the</strong> additional constra<strong>in</strong>t that <strong>the</strong> sum <strong>of</strong> <strong>the</strong> fluxes <strong>of</strong> 18 Oand 16 O cannot add any new <strong>sulfate</strong>, i.e., <strong>the</strong>y must cancelbðS 16 O 4 ÞþbðS 18 O 4 Þ0ð11Þwhere b denotes <strong>the</strong> exchange velocity. Thus <strong>the</strong> isotopiccomposition <strong>of</strong> <strong>the</strong> output flux becomes simply a function<strong>of</strong> <strong>the</strong> <strong>isotope</strong> equilibrium value and we can write it as acomb<strong>in</strong>ation <strong>of</strong> <strong>the</strong> <strong>in</strong>put and output flux asbðS 16 ½S 16 O 4 Š1O 4 Þ¼b þð12Þ½SO 4 Š 1 þðd out =1000 þ 1ÞR 0bðS 18 ½S 18 O 4 ŠO 4 Þ¼b þ ðd out=1000 þ 1ÞR 0ð13Þ½SO 4 Š 1 þðd out =1000 þ 1ÞR 0where R 0 refers to <strong>the</strong> isotopic ratio <strong>of</strong> V-SMOW, andd out ¼ d <strong>in</strong> ð1 kÞþkðd H2 O þ Þ ð14Þand d H2 O denotes <strong>the</strong> oxygen isotopic composition <strong>of</strong> <strong>the</strong><strong>pore</strong>-<strong>water</strong> H 2 O. The reaction transport model to describe<strong>the</strong> oxygen <strong>isotope</strong> exchange for 16 O is <strong>the</strong>n a comb<strong>in</strong>ation<strong>of</strong> Eqs. (6, 10 and 11)u o½S16 O 4 Šot¼u o½S16 O 4 Š oDozux o½S16 O 4 Šozand similarly for [S 18 O 4 ].oz þ ½S 16 O 4 ŠuDo2 oz 22.4. Model<strong>in</strong>g cell external oxidationþ D ou o½S 16 O 4 Šoz ozuf ðS 16 O 4 ÞþubðS 16 O 4 Þð15ÞCell external oxidation <strong>of</strong> H 2 S can be achieved througha solid oxidant like ferric oxihydroxide. As bioturbationwill only affect <strong>the</strong> benthic boundary layer, we can treatour oxidant as a solid, and writeoðð1uÞ½X s ŠÞot¼ oðð1 uÞx s½X s ŠÞozð1 uÞf n ð16Þwhere X s denotes a solid oxidant, f <strong>the</strong> gross flux <strong>of</strong> SO 4 2 ,x s <strong>the</strong> sedimentation rate, and n <strong>the</strong> molar ratio <strong>of</strong> <strong>the</strong> oxidationreaction.3. RESULTS AND DISCUSSIONUnder steady state conditions with no lateral changes <strong>of</strong>boundary conditions, results <strong>of</strong> a 1-D model must equal <strong>the</strong>results <strong>of</strong> a 2-D model. However, if lateral changes (e.g., <strong>of</strong><strong>sulfate</strong> concentration or biological activity) do occur, 1-Dmodels may somewhat overestimate <strong>sulfate</strong> reduction rates.At present, <strong>the</strong> hydrogeology <strong>of</strong> ODP-Site 1130 is not sufficientlyconstra<strong>in</strong>ed to allow for a detailed 2-D model.However, we can set up a 2-D model which is sufficientlysimilar (i.e., it uses <strong>the</strong> same spatial scales and similar fluidvelocities as observed at ODP Site 1130) to <strong>in</strong>vestigate <strong>the</strong>potential error <strong>in</strong>troduced by <strong>the</strong> 1-D assumptions. Tocompare <strong>the</strong> results <strong>of</strong> <strong>the</strong> two models, we plot a 1-D crosssection <strong>of</strong> <strong>the</strong> 2-D model, aga<strong>in</strong>st <strong>the</strong> results <strong>of</strong> a 1-D modelus<strong>in</strong>g <strong>the</strong> same parameters as <strong>the</strong> 2-D model. Fig. 7 showthat <strong>the</strong> ma<strong>in</strong> differences between <strong>the</strong> two approaches are2found <strong>in</strong> <strong>the</strong> result<strong>in</strong>g concentration <strong>of</strong> SO 4and H 2 S.(Fig. 7). This implies that <strong>the</strong> 1-D model overestimates<strong>the</strong> volumetric <strong>sulfate</strong> reduction rate compared to <strong>the</strong> 2-Dmodel. However, <strong>the</strong> isotopic composition rema<strong>in</strong>s <strong>the</strong>same. We <strong>the</strong>refore conclude that <strong>the</strong> total fluxes computedby our model may conta<strong>in</strong> a certa<strong>in</strong> error, but that <strong>the</strong> ratio<strong>of</strong> <strong>the</strong> fluxes should be accurate.The d 18 O SO4 2 data from ODP Site 1130 show a dist<strong>in</strong>ctive<strong>in</strong>crease up to a maximum <strong>of</strong> 28.6‰ at 27.5 mbsf, andsubsequently decrease to 11.6‰ at 300 mbsf (Fig. 8). Thereturn to values close to <strong>the</strong> sea<strong>water</strong> <strong>sulfate</strong> <strong>isotope</strong> compositionis mostly a function <strong>of</strong> <strong>the</strong> upwell<strong>in</strong>g br<strong>in</strong>e supply<strong>in</strong>g<strong>sulfate</strong> with a d 18 O SO4 2 11&. We will first explorewhe<strong>the</strong>r this d 18 O SO4 2 signal can be expla<strong>in</strong>ed with a k<strong>in</strong>etic<strong>isotope</strong> effect alone. The suggested ratio between <strong>the</strong>fractionation factors for O and S vary from 1:1.4 to 1:4