- Page 3 and 4:
Well-being MattersA Social Report f
- Page 5 and 6:
iiiTable of ContentsList of TablesL
- Page 7 and 8:
contentsvList of TablesTable 6.1 Co
- Page 9 and 10:
contents viiFigure 6.31Figure 6.32F
- Page 11 and 12:
contents ixFigure 7.32Percentage of
- Page 13:
contents xiFigure 8.19 Marital Stat
- Page 17:
xvAbbreviationsADHEAAssociation for
- Page 21:
Part IV of the report documents wel
- Page 24 and 25:
6The Children Provision of Socialan
- Page 26 and 27:
s Article 6 - the right to life, su
- Page 28 and 29:
s Towards a composite index of well
- Page 30 and 31:
10well-being has been produced by a
- Page 32 and 33:
12These domains and indicators seek
- Page 34 and 35:
14Many children in vulnerable situa
- Page 36 and 37:
16Happiness and Life SatisfactionBe
- Page 38 and 39:
18Figure 6.4 Child Poverty in Irela
- Page 40 and 41:
20On this measure of deprivation, 1
- Page 42 and 43:
22It would also be relevant to trac
- Page 44 and 45:
24Figure 6.8Rates of Return to the
- Page 46 and 47:
26Unicef has qualified their findin
- Page 48 and 49:
28Almost two thirds (65 per cent) o
- Page 50 and 51:
30Figure 6.11 Educational Achieveme
- Page 52 and 53:
32Overall, a key challenge is to en
- Page 54 and 55:
346.5.3 Commentary on Work and Part
- Page 56 and 57:
36This means ‘getting the right p
- Page 58 and 59:
38%1086Figure 6.12 Percentage of Ho
- Page 60 and 61:
40The proportion of children in Ire
- Page 62 and 63:
42Peer RelationshipsChildren’s re
- Page 64 and 65:
44may undermine other aspects of th
- Page 66 and 67:
466.7 Community and Environment6.7.
- Page 68 and 69:
48Figure 6.20 Percentage of Student
- Page 70 and 71:
50Figure 6.22 Percentage of Young P
- Page 72 and 73:
52Better data are required on child
- Page 74 and 75:
54Smoking CigarettesThe tobacco use
- Page 76 and 77:
56Using cannabisThere are many diff
- Page 78 and 79:
58Figure 6.27 Percentage of Childre
- Page 80 and 81:
60Figure 6.29 Percentage of Childre
- Page 82 and 83:
62Admissions to Psychiatric Hospita
- Page 84 and 85:
64for health and well-being. Irish
- Page 86 and 87:
66The United Kingdom, which has a h
- Page 88 and 89:
68Figure 6.32 Percentage of Childre
- Page 90 and 91:
70Figure 6.34 Children who Report F
- Page 92 and 93:
72Child AbuseThe third component of
- Page 94 and 95:
74Figure 6.38 Does Society Provide
- Page 96 and 97:
76Dáil na nÓg and the establishme
- Page 98 and 99:
78have a high risk of poverty, and
- Page 100 and 101:
80Table 6.2Reading Literacy Example
- Page 102 and 103:
782People of Working Age
- Page 104 and 105:
847.2 Assessing the Well-being of P
- Page 106 and 107:
86These domains and indicators atte
- Page 108 and 109:
88Figure 7.1 Percentage of the Popu
- Page 110 and 111:
90Social ExpenditureIn relation to
- Page 112 and 113:
92Income DistributionThe average ne
- Page 114 and 115:
94Income PovertyThe second componen
- Page 116 and 117:
96In general, the working age popul
- Page 118 and 119:
98One of the key issues to be addre
- Page 120 and 121:
100Figure 7.12Employment Rates of P
- Page 122 and 123:
102On average, in Ireland, women we
- Page 124 and 125:
104Satisfaction With Work and Free
- Page 126 and 127:
106Figure 7.17 shows numbers of men
- Page 128 and 129:
108Jobseeker ClaimantsThe third ind
- Page 130 and 131:
110Life-long LearningThe second ind
- Page 132 and 133:
112People who become unemployed are
- Page 134 and 135:
1147.5.3 Commentary on Work and Par
- Page 136 and 137:
116Figure 7.23 Percentage of Births
- Page 138 and 139:
118Figure 7.25 Age Profile of Mothe
- Page 140 and 141:
120Recipients of Carers PaymentsThe
- Page 142 and 143:
122Specific priority actions includ
- Page 144 and 145:
124Figure 7.29 Occupation of Mortga
- Page 146 and 147:
126Community - Getting Practical He
- Page 148 and 149:
128Attendance at Arts EventsInvolve
- Page 150 and 151:
130SummaryIreland has traditionally
- Page 152 and 153:
132While a relatively high level of
- Page 154 and 155:
134In 2007, over one quarter (27 pe
- Page 156 and 157:
136Figure 7.39 Percentage of Smoker
- Page 158 and 159:
138Figure 7.41 Body Weight by Age a
- Page 160 and 161:
140Figure 7.43 Percentage of Respon
- Page 162 and 163:
142Figure 7.45 Mean Score on Mental
- Page 164 and 165:
144Towards 2016 does not contain a
- Page 166 and 167:
146The graphic shows that 71 per ce
- Page 168 and 169:
148Figure 7.48 Percentage of Employ
- Page 170 and 171:
150Figure 7.50 Perception of Crime
- Page 172 and 173:
152Intercultural DialogueThe second
- Page 174 and 175:
1547.9.3 Commentary on Democracy an
- Page 176 and 177:
156Participation in education and t
- Page 178 and 179:
158Three quarters of the population
- Page 180 and 181:
160Table 7.2Suports for People of W
- Page 182 and 183:
8162Older People
- Page 184 and 185:
164The social and economic contribu
- Page 186 and 187:
166The Australian Office of Ageing
- Page 188 and 189:
1688.2 Assessing Older People’s W
- Page 190 and 191:
170Table 8.2 Construction of Older
- Page 192 and 193:
1728.3 The Context for Older People
- Page 194 and 195:
174The proportion of the population
- Page 196 and 197:
176Figure 8.7 Life Satisfaction, OE
- Page 198 and 199:
178Figure 8.8Composition of Single
- Page 200 and 201:
180Figure 8.10Male Net Pension Repl
- Page 202 and 203:
182Consistent PovertyIncome poverty
- Page 204 and 205:
184Figure 8.15Heating Deprivation A
- Page 206 and 207:
186Policy commitments acknowledge t
- Page 208 and 209:
188Figure 8.17Average Exit Age from
- Page 210 and 211:
190Information on current participa
- Page 212 and 213:
192Marital StatusUnder family struc
- Page 214 and 215:
194LonelinessThe National Council o
- Page 216 and 217:
196Resident in Nursing Homes and Ho
- Page 218 and 219:
198Towards 2016 recognises the ‘i
- Page 220 and 221:
200Housing ProblemsSome 8.6 per cen
- Page 222 and 223:
202Figure 8.26Percentage of Respond
- Page 224 and 225: 204In summary, there is a wide rang
- Page 226 and 227: 206SummaryJust under 10 per cent of
- Page 228 and 229: 2088.8 Health8.8.1 Measuring the He
- Page 230 and 231: 210Some 62 per cent of people aged
- Page 232 and 233: 212Figure 8.33 Percentage of Respon
- Page 234 and 235: 214Figure 8.35 Percentage of Smoker
- Page 236 and 237: 216Figure 8.37 Body Weight of 65 Ye
- Page 238 and 239: 218Figure 8.39 Percentage of Respon
- Page 240 and 241: 2208.8.3 Commentary on the Health o
- Page 242 and 243: 222Voter ParticipationThe second in
- Page 244 and 245: 224Perception of CrimeThe fear of c
- Page 246 and 247: 226When asked about forms of maltre
- Page 248 and 249: 228Russell et al., (2008) explored
- Page 250 and 251: 230Much of current international de
- Page 252 and 253: 232socio-economic group to be able
- Page 254 and 255: 234Table 8.3Supports for Older Peop
- Page 256 and 257: 69The People Provision With Disabil
- Page 258 and 259: 238As the implementation of Towards
- Page 260 and 261: 240Disability in IrelandWithin Irel
- Page 262 and 263: 242Irish data were included from th
- Page 264 and 265: 244Towards 2016 Vision and High Lev
- Page 266 and 267: 246The framework of key indicators
- Page 268 and 269: 248age structures. 158 The Mid-East
- Page 270 and 271: 250accounting for 29 per cent of pe
- Page 272 and 273: 252In terms of PPS expenditure 161
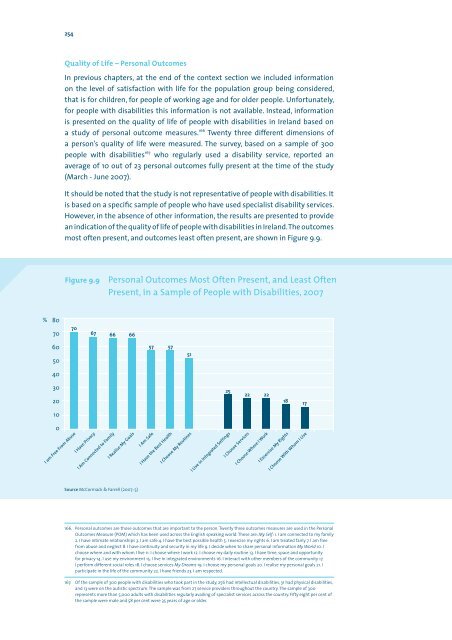
- Page 276 and 277: 256Figure 9.10 Incomes of People wi
- Page 278 and 279: 258%4035302520151050Figure 9.12 Per
- Page 280 and 281: 260Further examination of the data
- Page 282 and 283: 262their full implementation. Impro
- Page 284 and 285: 264Figure 9.16 Percentage in Employ
- Page 286 and 287: 266the lack of policy and guideline
- Page 288 and 289: 268Figure 9.20 Students with Disabi
- Page 290 and 291: 270Work by Gannon and Nolan, using
- Page 292 and 293: 272children with special needs can
- Page 294 and 295: 274In order to access the labour fo
- Page 296 and 297: 276People with disabilities may hav
- Page 298 and 299: 278Figure 9.26 Percentage having a
- Page 300 and 301: 280term it will be important to con
- Page 302 and 303: 282Figure 9.29 Housing Tenure, 2006
- Page 304 and 305: 284Figure 9.30 (based on a survey o
- Page 306 and 307: 286Figure 9.31 shows that people wi
- Page 308 and 309: 2889.8 Health9.8.1 Measuring the He
- Page 310 and 311: 290Use of Aids/ServicesThe second c
- Page 312 and 313: 292All of this information, from th
- Page 314 and 315: 294they needed an aid or service, v
- Page 316 and 317: 296Voting IntentionFigure 9.37 show
- Page 318 and 319: 298with intellectual disabilities a
- Page 320 and 321: 300Figure 9.40 Attitudes to People
- Page 322 and 323: 3029.10 ConclusionThis chapter has
- Page 324 and 325:
304buildings has improved as a resu
- Page 326 and 327:
306An example is used here to illus
- Page 328 and 329:
BAppendix BBrofenbrenner’s Ecolog
- Page 330 and 331:
CAppendix CUnicef’s Summary of Ch
- Page 332 and 333:
312Table C1Child Well-being Across
- Page 334 and 335:
DAppendix DExplanation of NationalD
- Page 336 and 337:
316had ‘just a little difficulty
- Page 338 and 339:
EAppendix EDisability IndicatorsPro
- Page 340 and 341:
FAppendix F ADomains Policy Proposa
- Page 342 and 343:
GAppendix G APolicy Questions Propo
- Page 345 and 346:
325ReferencesAHEAD (2000) Disabilit
- Page 347 and 348:
eferences 327Department of Environm
- Page 349 and 350:
eferences 329Halpenny, A.M. and Gil
- Page 351 and 352:
eferences 331National Council on Ag
- Page 353 and 354:
eferences 333Reception and Integrat