
You also want an ePaper? Increase the reach of your titles
YUMPU automatically turns print PDFs into web optimized ePapers that Google loves.
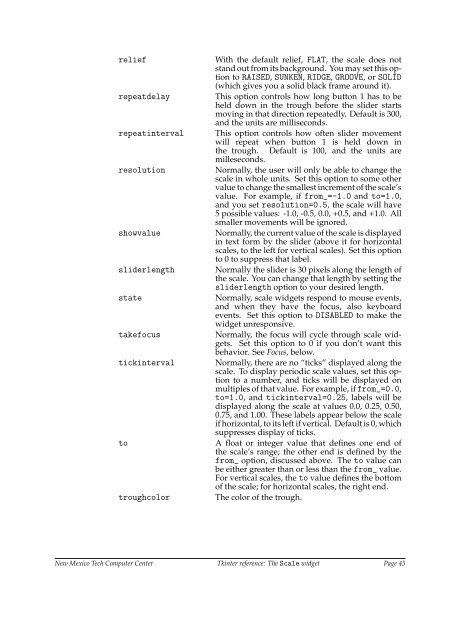
eliefrepeatdelayrepeatintervalresolutionshowvaluesliderlengthstatetakefocustickintervaltotroughcolorWith the default relief, FLAT, the scale does notstand out from its background. You may set this optionto RAISED, SUNKEN, RIDGE, GROOVE, or SOLID(which gives you a solid black frame around it).This option controls how long button 1 has to beheld down in the trough be<strong>for</strong>e the slider startsmoving in that direction repeatedly. Default is 300,and the units are milliseconds.This option controls how often slider movementwill repeat when button 1 is held down inthe trough. Default is 100, and the units aremilleseconds.Normally, the user will only be able to change thescale in whole units. Set this option to some othervalue to change the smallest increment of the scale’svalue. For example, if from_=-1.0 and to=1.0,and you set resolution=0.5, the scale will have5 possible values: -1.0, -0.5, 0.0, +0.5, and +1.0. Allsmaller movements will be ignored.Normally, the current value of the scale is displayedin text <strong>for</strong>m by the slider (above it <strong>for</strong> horizontalscales, to the left <strong>for</strong> vertical scales). Set this optionto 0 to suppress that label.Normally the slider is 30 pixels along the length ofthe scale. You can change that length by setting thesliderlength option to your desired length.Normally, scale widgets respond to mouse events,and when they have the focus, also keyboardevents. Set this option to DISABLED to make thewidget unresponsive.Normally, the focus will cycle through scale widgets.Set this option to 0 if you don’t want thisbehavior. See Focus, below.Normally, there are no “ticks” displayed along thescale. To display periodic scale values, set this optionto a number, and ticks will be displayed onmultiples of that value. For example, if from_=0.0,to=1.0, and tickinterval=0.25, labels will bedisplayed along the scale at values 0.0, 0.25, 0.50,0.75, and 1.00. These labels appear below the scaleif horizontal, to its left if vertical. Default is 0, whichsuppresses display of ticks.A float or integer value that defines one end ofthe scale’s range; the other end is defined by thefrom_ option, discussed above. The to value canbe either greater than or less than the from_ value.For vertical scales, the to value defines the bottomof the scale; <strong>for</strong> horizontal scales, the right end.The color of the trough.New Mexico Tech Computer Center <strong>Tkinter</strong> <strong>reference</strong>: The Scale widget Page 45