Effect of CASMO-5 Cross-Section Data and Doppler ... - Studsvik
Effect of CASMO-5 Cross-Section Data and Doppler ... - Studsvik
Effect of CASMO-5 Cross-Section Data and Doppler ... - Studsvik

Create successful ePaper yourself
Turn your PDF publications into a flip-book with our unique Google optimized e-Paper software.
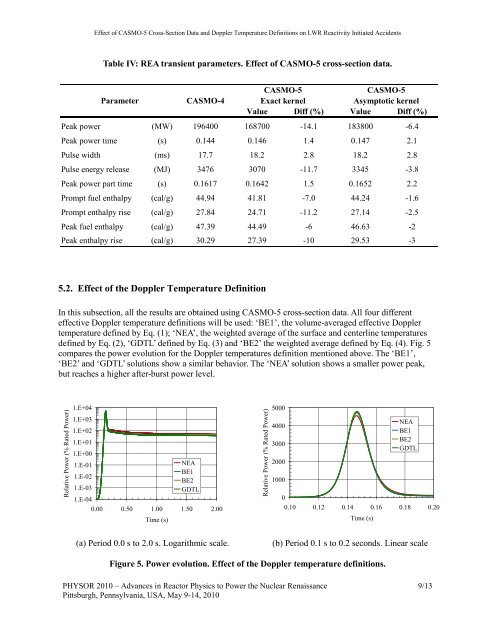
<strong>Effect</strong> <strong>of</strong> <strong>CASMO</strong>-5 <strong>Cross</strong>-<strong>Section</strong> <strong>Data</strong> <strong>and</strong> <strong>Doppler</strong> Temperature Definitions on LWR Reactivity Initiated AccidentsTable IV: REA transient parameters. <strong>Effect</strong> <strong>of</strong> <strong>CASMO</strong>-5 cross-section data.Parameter<strong>CASMO</strong>-4<strong>CASMO</strong>-5Exact kernel<strong>CASMO</strong>-5Asymptotic kernelValue Diff (%) Value Diff (%)Peak power (MW) 196400 168700 -14.1 183800 -6.4Peak power time (s) 0.144 0.146 1.4 0.147 2.1Pulse width (ms) 17.7 18.2 2.8 18.2 2.8Pulse energy release (MJ) 3476 3070 -11.7 3345 -3.8Peak power part time (s) 0.1617 0.1642 1.5 0.1652 2.2Prompt fuel enthalpy (cal/g) 44.94 41.81 -7.0 44.24 -1.6Prompt enthalpy rise (cal/g) 27.84 24.71 -11.2 27.14 -2.5Peak fuel enthalpy (cal/g) 47.39 44.49 -6 46.63 -2Peak enthalpy rise (cal/g) 30.29 27.39 -10 29.53 -35.2. <strong>Effect</strong> <strong>of</strong> the <strong>Doppler</strong> Temperature DefinitionIn this subsection, all the results are obtained using <strong>CASMO</strong>-5 cross-section data. All four differenteffective <strong>Doppler</strong> temperature definitions will be used: ‘BE1’, the volume-averaged effective <strong>Doppler</strong>temperature defined by Eq. (1); ‘NEA’, the weighted average <strong>of</strong> the surface <strong>and</strong> centerline temperaturesdefined by Eq. (2), ‘GDTL’ defined by Eq. (3) <strong>and</strong> ‘BE2’ the weighted average defined by Eq. (4). Fig. 5compares the power evolution for the <strong>Doppler</strong> temperatures definition mentioned above. The ‘BE1’,‘BE2’ <strong>and</strong> ‘GDTL’ solutions show a similar behavior. The ‘NEA’ solution shows a smaller power peak,but reaches a higher after-burst power level.Relative Power (% Rated Power)1.E+041.E+031.E+021.E+011.E+001.E-011.E-021.E-031.E-040.00 0.50 1.00 1.50 2.00Time (s)NEABE1BE2GDTLRelative Power (% Rated Power)5000400030002000100000.10 0.12 0.14 0.16 0.18 0.20Time (s)NEABE1BE2GDTL(a) Period 0.0 s to 2.0 s. Logarithmic scale.(b) Period 0.1 s to 0.2 seconds. Linear scaleFigure 5. Power evolution. <strong>Effect</strong> <strong>of</strong> the <strong>Doppler</strong> temperature definitions.PHYSOR 2010 – Advances in Reactor Physics to Power the Nuclear RenaissancePittsburgh, Pennsylvania, USA, May 9-14, 20109/13