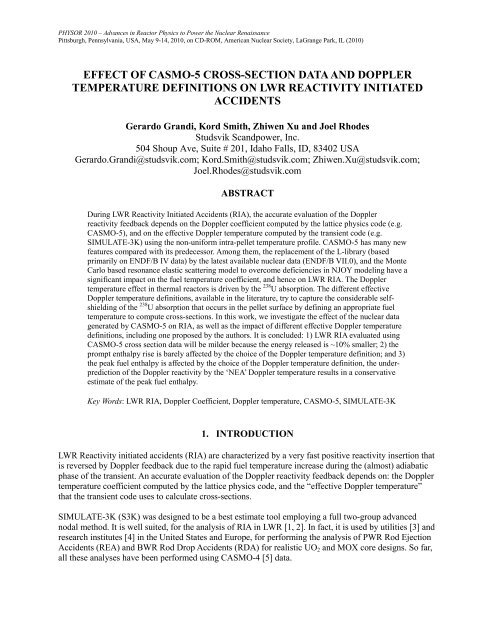
Effect of CASMO-5 Cross-Section Data and Doppler ... - Studsvik
Effect of CASMO-5 Cross-Section Data and Doppler ... - Studsvik
Effect of CASMO-5 Cross-Section Data and Doppler ... - Studsvik
Create successful ePaper yourself
Turn your PDF publications into a flip-book with our unique Google optimized e-Paper software.
<strong>Effect</strong> <strong>of</strong> <strong>CASMO</strong>-5 <strong>Cross</strong>-<strong>Section</strong> <strong>Data</strong> <strong>and</strong> <strong>Doppler</strong> Temperature Definitions on LWR Reactivity Initiated AccidentsThe <strong>Doppler</strong> reactivity effects are linear with the perturbation in the square root <strong>of</strong> the fuel temperature.Therefore, k-effective values for any fuel temperature can be well approximated using the Table I flattemperature data. Performing this procedure, the <strong>Doppler</strong> reactivity worth can be evaluated for thedifferent effective <strong>Doppler</strong> temperature definitions mentioned above, i.e. ‘BE1’, ‘NEA’ <strong>and</strong> ‘GDTL’.Another effective <strong>Doppler</strong> temperature, namely ‘BE2’, will be defined by Eq. (4) below. Results for allfour effective <strong>Doppler</strong> temperatures are compared in Table II against the exact reactivity computed usingthe non-uniform temperature pr<strong>of</strong>iles.Table II: <strong>Doppler</strong> reactivity for different definitions <strong>of</strong> effective <strong>Doppler</strong> temperature.Description<strong>Doppler</strong> Reactivity (Delta-K/K)Error (%)FromCaseToCaseExact BE1 NEA GDTL BE2 BE1 NEA GDTL BE21 4 -981 -1056 -675 -975 -981 7.7 -31.2 -0.6 0.01 5 -1828 -1935 -1247 -1732 -1802 5.8 -31.8 -5.3 -1.41 6 -1989 -1935 -2392 -1915 -2000 -2.7 20.3 -3.7 0.6Note that, the use <strong>of</strong> the ‘BE1’ effective temperature over-estimates the <strong>Doppler</strong> reactivity for quadraticpr<strong>of</strong>iles, <strong>and</strong> under-estimates the <strong>Doppler</strong> reactivity for the inverted temperature pr<strong>of</strong>ile. The ‘NEA’temperature under-estimates the <strong>Doppler</strong> reactivity for quadratic temperature pr<strong>of</strong>iles. The opposite is truefor inverted temperature pr<strong>of</strong>iles. The ‘GDTL’ always underestimates the <strong>Doppler</strong> reactivity, thusrendering conservative results for LWR reactivity initiated accidents. ‘GDTL’ performs very well for atypical HFP quadratic temperature pr<strong>of</strong>ile; the improvement with respect to ‘BE1’ is noticeable. Forhigher quadratic temperature pr<strong>of</strong>iles, the <strong>Doppler</strong> feedback is under-estimated by ~5%; <strong>and</strong> for theinverted temperature pr<strong>of</strong>ile ~4%.Using the k-effective values <strong>of</strong> Table II, one can define another effective <strong>Doppler</strong> temperature, namely‘BE2’. The ‘BE2’ effective <strong>Doppler</strong> temperature is defined such that its <strong>Doppler</strong> reactivity matches theexact reactivity for the non-uniform cases. The ‘BE2’ <strong>Doppler</strong> temperature (T BE2 ) is written as a weightedaverage <strong>of</strong> the volume-averaged temperature (T BE1 ), <strong>and</strong> the fuel surface temperature (T S ), TT)1 ((4)BE 2 BE1where the value <strong>of</strong> is empirically adjusted to match the reactivity between the case 1 (representative <strong>of</strong>HZP) <strong>and</strong> case 4 (representative <strong>of</strong> HFP). <strong>Effect</strong>ive <strong>Doppler</strong> temperatures computed using Eq. (4) with0.92, for the pin cell problem are presented in Table VI on Appendix A. Last column in Table IIcompares the ‘BE2’ <strong>Doppler</strong> reactivity worth. Note that error introduced by the ‘BE2’ approximation, forall cases presented here, is lower than 1.5%.SPHYSOR 2010 – Advances in Reactor Physics to Power the Nuclear RenaissancePittsburgh, Pennsylvania, USA, May 9-14, 20105/13
Gerardo Gr<strong>and</strong>i et.al.4. DESCRIPTION OF THE ROD EJECTION ACCIDENT SCENARIOThe problem consists in analyzing a rod ejection in a PWR MOX/UO 2 core at Hot Zero Power conditions:10 -4 rated power, core inlet temperature 560 K, core pressure 15.5 MPa. The model was constructed basedon the OECD “PWR MOX/UO2 Core Transient Benchmark [12].” It is important to remark that: <strong>Cross</strong> sections were generated using <strong>CASMO</strong>-4 / ENDF/B IV <strong>and</strong> <strong>CASMO</strong>-5 / ENDF/B VII.0. The known state <strong>of</strong> the core (history data) was assumed to be the same regardless <strong>of</strong> the crosssectionset used in the transient calculations. The 3D fuel temperature distribution is evaluated by solving the one-dimensional, radial heatconduction equation for the average pin <strong>of</strong> each node. For safety evaluations, all the pins for eachnode may be modeled [2]. The closed channel thermal hydraulics module provides thetemperature <strong>of</strong> the coolant surrounding the pin which serves as the boundary condition for thefuel temperature calculation. Fuel thermal conductivity for UO 2 <strong>and</strong> MOX are computed using the Nuclear Fuel Industriescorrelations as reported in reference [14]. The gap conductance model is taken from the INTERPIN-4 code [15] <strong>and</strong> it is functionalizedversus exposure <strong>and</strong> temperature. The intra-pellet power pr<strong>of</strong>iles are a function <strong>of</strong> the fuel type (MOX/UO 2 ) <strong>and</strong> burnup. Valueswere taken from INTERPIN-4. Fig. 2 illustrates those pr<strong>of</strong>iles for 0.0 GWd/T, 20 GWd/T <strong>and</strong> 40GWd/T.All the control rod banks are fully inserted <strong>and</strong> all the shutdown banks are fully withdrawn. The initialboron concentration is determined to make the reactor critical in steady state. Note that in the OECDbenchmark; only one <strong>of</strong> the four rods in position E5 is ejected. However, in the present work all four rodsare ejected. The rod ejection starts at time 0 seconds <strong>and</strong> the rods are ejected in 0.1 s. The transient isfollowed for 5 s. The chosen spatial discretization is: radial mesh <strong>of</strong> 2x2 nodes per assembly (x=10.7cm) <strong>and</strong> 24 axial nodes (z=15.24 cm). The fuel pellet is divided in nine equal volume rings, <strong>and</strong> thecladding in two rings. Following the recommendation from Gr<strong>and</strong>i [16], solutions were obtained with asmall time step (0.1 ms) to avoid any spurious effect from the numerical integration.5. RESULTSResults for two different exercises will be discussed in what follows. The objective <strong>of</strong> the first exercise isto assess the effect <strong>of</strong> the <strong>CASMO</strong>-5 nuclear data on the rod ejection accident key parameters, namely:peak power, time <strong>of</strong> peak power, peak power width, <strong>and</strong> peak fuel enthalpy. The objective <strong>of</strong> the secondexercise is to assess the influence <strong>of</strong> the <strong>Doppler</strong> temperature definition on the previously mentionedparameters.5.1. <strong>Effect</strong> <strong>of</strong> the <strong>CASMO</strong>-5 <strong>Cross</strong>-<strong>Section</strong> <strong>Data</strong>In this subsection, all the calculations are performed using the ‘BE1’ effective <strong>Doppler</strong> temperaturedefined by Eq. (1). For simplicity, the S3K results obtained using <strong>CASMO</strong>-4 nuclear data will be referredas ‘<strong>CASMO</strong>-4’ case or solution; the results computed using <strong>CASMO</strong>-5 data will be labeled ‘<strong>CASMO</strong>-5’;<strong>and</strong> finally, the results computed using <strong>CASMO</strong>-5 data with the asymptotic scattering kernel (i.e. withoutthe <strong>CASMO</strong>-5 resonance elastic scattering model active) will be labeled ‘<strong>CASMO</strong>-5 Asymptotic’. TableIII presents relevant static -fraction, the static rod worthPHYSOR 2010 – Advances in Reactor Physics to Power the Nuclear RenaissancePittsburgh, Pennsylvania, USA, May 9-14, 20106/13
<strong>Effect</strong> <strong>of</strong> <strong>CASMO</strong>-5 <strong>Cross</strong>-<strong>Section</strong> <strong>Data</strong> <strong>and</strong> <strong>Doppler</strong> Temperature Definitions on LWR Reactivity Initiated Accidents(SRW)-re average <strong>Doppler</strong>. The main observations derived from Table III are: Relative differences in rod worth between ‘<strong>CASMO</strong>-5’ <strong>and</strong> ‘<strong>CASMO</strong>-4’ are less than 1%. Nosignificant differences are observed in the core- * . A difference <strong>of</strong> ~10% is observed in the <strong>Doppler</strong> coefficient. This result is consistent with thelattice results presented in Fig. 1. Differences in <strong>Doppler</strong> coefficient between ‘<strong>CASMO</strong>-5’ <strong>and</strong> ‘<strong>CASMO</strong>-4’ due to differences inthe nuclear data (i.e., ENDF/B VII.0 vs. ENDF/B IV) are less than 1.5%. The difference in<strong>Doppler</strong> coefficient is mainly due to the 238 U resonance elastic scattering treatment. It is expected, that the rod ejection accident computed with <strong>CASMO</strong>-5 cross-sections will bemilder. The total energy released during the power burst is proportional to the ratio <strong>of</strong> the promptreactivity <strong>and</strong> the <strong>Doppler</strong> coefficient. This ratio is ~11% smaller if <strong>CASMO</strong>-5 data is usedinstead <strong>of</strong> <strong>CASMO</strong>-4 data.Table III: Steady state REA parameters. <strong>Effect</strong> <strong>of</strong> <strong>CASMO</strong>-5 cross-section data.Parameter<strong>CASMO</strong>-4<strong>CASMO</strong>-5<strong>CASMO</strong>-5Exact kernelAsymptotic kernelValue Diff (%) Value Diff (%)Critical Boron (ppm) 1737 1738 0.1 1740 0.2SRW (pcm) 870 863 -0.8 864 -0.7 (pcm) 544 544 0.0 545 0.2 (1.E-05 s) 1.46 1.48 1.4 1.48 1.4 ($) 1.60 1.59 -0.8 1.59 -0.9 (pcm) 326 319 -2.1 319 -2.1 (pcm/K) -2.93 -3.24 10.6 -2.97 1.4Fig. 3 compares the power evolution for the ‘<strong>CASMO</strong>-4’ <strong>and</strong> ‘<strong>CASMO</strong>-5’ cases. Note that the ‘<strong>CASMO</strong>-5’ solution has a lower power peak, <strong>and</strong> a smaller peak width, <strong>and</strong> the energy release during the powerexcursion is smaller.Relative Power (% Rated Power)1.E+041.E+031.E+021.E+011.E+001.E-011.E-021.E-031.E-040.00 0.50 1.00 1.50 2.00Time (s)<strong>CASMO</strong>-4<strong>CASMO</strong>-5(a) Period 0.0 s to 2.0 s. Logarithmic scale.(b) Period 0.1 s to 0.2 seconds. Linear scaleFigure 3. Power evolution. <strong>Effect</strong> <strong>of</strong> <strong>CASMO</strong>-5 cross-section data.Relative Power (% Rated Power)60005000400030002000100000.10 0.12 0.14 0.16 0.18 0.20Time (s)<strong>CASMO</strong>-4<strong>CASMO</strong>-5* <strong>CASMO</strong>-5 delayed neutron fractions are not based on ENDF/B VII.0 data, but on the ENDF/B IV data used by <strong>CASMO</strong>-4.PHYSOR 2010 – Advances in Reactor Physics to Power the Nuclear RenaissancePittsburgh, Pennsylvania, USA, May 9-14, 20107/13
Gerardo Gr<strong>and</strong>i et.al.Fig. 4 compares the <strong>Doppler</strong> reactivity feedback <strong>and</strong> the (core average) <strong>Doppler</strong> temperature evolutionduring the rod ejection accident.<strong>Doppler</strong> Reactivity ($)0.200.00-0.20-0.40-0.60-0.80<strong>CASMO</strong>-4<strong>CASMO</strong>-5<strong>Doppler</strong> Reactivity ($)-0.80-0.85-0.90-0.95-1.000.0 1.0 2.0 3.0 4.0 5.0Time (s)<strong>Doppler</strong> Temperature (K)750700650600550<strong>CASMO</strong>-4<strong>CASMO</strong>-5-1.000.0 0.5 1.0 1.5 2.0 2.5 3.0Time (s)5000.0 0.5 1.0 1.5 2.0 2.5 3.0Time (s)Figure 4. <strong>Doppler</strong> reactivity <strong>and</strong> <strong>Doppler</strong> temperature. <strong>Effect</strong> <strong>of</strong> <strong>CASMO</strong>-5 cross-section data.Note that the <strong>Doppler</strong> reactivity is the same in the ‘<strong>CASMO</strong>-4’ <strong>and</strong> ‘<strong>CASMO</strong>-5’ cases. This result iscounter intuitive due the more negative fuel temperature coefficient reported in Table III. However, sincethe external positive reactivity inserted in both cases differ only ~7 pcm; the <strong>Doppler</strong> reactivity tocompensate the inserted reactivity must be approximately the same. Due to the ~10% difference in the<strong>Doppler</strong> coefficient (see Table III), the <strong>Doppler</strong> temperature increase in the ‘<strong>CASMO</strong>-5’ case is ~10%smaller.Table IV summarizes the rod ejection accident results, in terms <strong>of</strong> power <strong>and</strong> fuel enthalpy, for ‘<strong>CASMO</strong>-4’, ‘<strong>CASMO</strong>-5’, <strong>and</strong> ‘<strong>CASMO</strong>-5 Asymptotic’ cases.The main observations derived from Table IV are: The energy release in the ‘<strong>CASMO</strong>-5’ case is 88 % <strong>of</strong> the energy release in the ‘<strong>CASMO</strong>-4’ case. Since the energy release is smaller in ‘<strong>CASMO</strong>-5’ <strong>and</strong> the peaking factors during the transient arealmost identical (not shown), the enthalpy rise in the ‘<strong>CASMO</strong>-5’ case is approximately ~88% <strong>of</strong>the enthalpy rise in the ‘<strong>CASMO</strong>-4’ case. The resonance treatment implemented in ‘<strong>CASMO</strong>-5’ is the key element for the fuel enthalpyreduction during this transient.PHYSOR 2010 – Advances in Reactor Physics to Power the Nuclear RenaissancePittsburgh, Pennsylvania, USA, May 9-14, 20108/13
<strong>Effect</strong> <strong>of</strong> <strong>CASMO</strong>-5 <strong>Cross</strong>-<strong>Section</strong> <strong>Data</strong> <strong>and</strong> <strong>Doppler</strong> Temperature Definitions on LWR Reactivity Initiated AccidentsTable IV: REA transient parameters. <strong>Effect</strong> <strong>of</strong> <strong>CASMO</strong>-5 cross-section data.Parameter<strong>CASMO</strong>-4<strong>CASMO</strong>-5Exact kernel<strong>CASMO</strong>-5Asymptotic kernelValue Diff (%) Value Diff (%)Peak power (MW) 196400 168700 -14.1 183800 -6.4Peak power time (s) 0.144 0.146 1.4 0.147 2.1Pulse width (ms) 17.7 18.2 2.8 18.2 2.8Pulse energy release (MJ) 3476 3070 -11.7 3345 -3.8Peak power part time (s) 0.1617 0.1642 1.5 0.1652 2.2Prompt fuel enthalpy (cal/g) 44.94 41.81 -7.0 44.24 -1.6Prompt enthalpy rise (cal/g) 27.84 24.71 -11.2 27.14 -2.5Peak fuel enthalpy (cal/g) 47.39 44.49 -6 46.63 -2Peak enthalpy rise (cal/g) 30.29 27.39 -10 29.53 -35.2. <strong>Effect</strong> <strong>of</strong> the <strong>Doppler</strong> Temperature DefinitionIn this subsection, all the results are obtained using <strong>CASMO</strong>-5 cross-section data. All four differenteffective <strong>Doppler</strong> temperature definitions will be used: ‘BE1’, the volume-averaged effective <strong>Doppler</strong>temperature defined by Eq. (1); ‘NEA’, the weighted average <strong>of</strong> the surface <strong>and</strong> centerline temperaturesdefined by Eq. (2), ‘GDTL’ defined by Eq. (3) <strong>and</strong> ‘BE2’ the weighted average defined by Eq. (4). Fig. 5compares the power evolution for the <strong>Doppler</strong> temperatures definition mentioned above. The ‘BE1’,‘BE2’ <strong>and</strong> ‘GDTL’ solutions show a similar behavior. The ‘NEA’ solution shows a smaller power peak,but reaches a higher after-burst power level.Relative Power (% Rated Power)1.E+041.E+031.E+021.E+011.E+001.E-011.E-021.E-031.E-040.00 0.50 1.00 1.50 2.00Time (s)NEABE1BE2GDTLRelative Power (% Rated Power)5000400030002000100000.10 0.12 0.14 0.16 0.18 0.20Time (s)NEABE1BE2GDTL(a) Period 0.0 s to 2.0 s. Logarithmic scale.(b) Period 0.1 s to 0.2 seconds. Linear scaleFigure 5. Power evolution. <strong>Effect</strong> <strong>of</strong> the <strong>Doppler</strong> temperature definitions.PHYSOR 2010 – Advances in Reactor Physics to Power the Nuclear RenaissancePittsburgh, Pennsylvania, USA, May 9-14, 20109/13
Gerardo Gr<strong>and</strong>i et.al.Fig.6 shows the evolution <strong>of</strong> the <strong>Doppler</strong> reactivity <strong>and</strong> the <strong>Doppler</strong> temperature during the transient.During the initial rapid power increase the problem is almost adiabatic, <strong>and</strong> the pin fuel temperature peaksnear the pellet surface due to the intra-pellet power shape (see Fig. 2). As the transient progresses, the heatconduction in the pin gradually reduces the surface temperature with respect to the centerline temperature.This behavior is illustrated in Fig. 7 for a pin in a fresh MOX assembly close to the ejected rod, <strong>and</strong> a pinin the UO 2 assembly where the rod is ejected.<strong>Doppler</strong> Reactivity ($)0.200.00-0.20-0.40-0.60-0.80NEABE1BE2GDTL<strong>Doppler</strong> Reactivity ($)-0.80-0.85-0.90-0.95-1.000.0 1.0 2.0 3.0 4.0 5.0Time (s)-1.000.0 0.5 1.0 1.5 2.0 2.5 3.0Time (s)<strong>Doppler</strong> Fuel Temperature (K)7006506005505000.0 0.5 1.0 1.5 2.0 2.5 3.0Time (s)NEABE1BE2GDTLFigure 6. <strong>Doppler</strong> reactivity <strong>and</strong> <strong>Doppler</strong> temperature. <strong>Effect</strong> <strong>of</strong> <strong>Doppler</strong> temperature definitions.MOX Fuel - Burnup 0.15 GWd/TUO2 Fuel - Burnup 37.5 GWd/TTemperature (K)1200110010009008007006005000 0.2 0.4 0.6 0.8 1Relative radiusTime (s)0.0000.1400.1450.1500.1600.2040.5041.0042.0045.000Temperature (K)1200110010009008007006005000 0.2 0.4 0.6 0.8 1Relative radiusTime (s)0.0000.1400.1450.1500.1600.2040.5041.0042.0045.000Figure 7. Evolution <strong>of</strong> the intra-pellet fuel temperature for 2 representative fuel pins.Table V summarizes the rod ejection accident results, in terms <strong>of</strong> power <strong>and</strong> fuel enthalpy, for the fourdifferent effective <strong>Doppler</strong> temperature cases. Differences with respect to the ‘BE1’ solution are alsoprovided. The main observations derived from Table V <strong>and</strong> Figs. 5-7 are: The ‘NEA’ effective <strong>Doppler</strong> temperature may predict a lower power peak depending on the corelife. However, the power generated in the after-burst computed using by the ‘NEA’ <strong>Doppler</strong>temperature will always be the highest because the heat conduction in the pin gradually increasesthe centerline temperature with respect to the surface temperature.PHYSOR 2010 – Advances in Reactor Physics to Power the Nuclear RenaissancePittsburgh, Pennsylvania, USA, May 9-14, 201010/13
<strong>Effect</strong> <strong>of</strong> <strong>CASMO</strong>-5 <strong>Cross</strong>-<strong>Section</strong> <strong>Data</strong> <strong>and</strong> <strong>Doppler</strong> Temperature Definitions on LWR Reactivity Initiated AccidentsThe ‘NEA’ definition produces larger pulse widths as noted by other researchers [4]. This effectpartially compensates the lower power peak, <strong>and</strong> the energy generated during the powerexcursion differs only 1% with respect to the ‘BE1’ case.The prompt enthalpy rise is barely affected by the choice <strong>of</strong> the <strong>Doppler</strong> temperature definition.However, the maximum fuel enthalpy could be affected. The under-prediction <strong>of</strong> the <strong>Doppler</strong>reactivity by the ‘NEA’ temperature results in a conservative estimate <strong>of</strong> the peak fuel enthalpy.Table V: Transient parameters: effect <strong>of</strong> the <strong>Doppler</strong> temperature definitionParameterBE1NEABE2GDTLValue Diff (%) Value Diff (%) Value Diff (%)Peak power (MW) 168700 162500 -3.7 167600 -0.7 170200 0.9Peak power time (s) 0.146 0.146 0.0 0.146 0.0 0.146 0.0Pulse width (ms) 18.2 18.7 2.7 18.2 0.0 18.1 -0.5Pulse energy release (MJ) 3070 3039 -1.0 3050 -0.7 3081 0.3Peak power part time (s) 0.1642 0.1647 0.3 0.1642 0.0 0.1641 -0.1Prompt fuel enthalpy (cal/g) 41.81 41.63 -0.4 41.73 -0.2 41.97 0.4Prompt enthalpy rise (cal/g) 24.71 24.53 -0.7 24.63 -0.3 24.87 0.6Peak fuel enthalpy (cal/g) 44.39 51.32 15.6 45.48 2.5 43.72 -1.5Peak enthalpy rise (cal/g) 27.29 34.22 25.4 28.38 4.0 26.62 -2.56. CONCLUSIONSThe effect <strong>of</strong> the cross-section data generated by <strong>CASMO</strong>-5, as well as the impact <strong>of</strong> different effective<strong>Doppler</strong> temperature definitions on LWR RIA was investigated. Key parameters <strong>of</strong> a PWR rod ejectionaccident scenario for a MOX/UO 2 core assuming the known core state have been compared.The main conclusions are: The LWR <strong>Doppler</strong> coefficient predicted using <strong>CASMO</strong>-5 cross-section data is ~10% morenegative at typical HZP conditions. The proper treatment <strong>of</strong> the 238 U resonance elastic scattering is the main contributor to the morenegative <strong>Doppler</strong> coefficient. The use <strong>of</strong> the volume-averaged <strong>Doppler</strong> temperature, Eq. (1), may overestimate the <strong>Doppler</strong>reactivity. The ‘NEA’, Eq. (2), effective <strong>Doppler</strong> temperature definition leads to very conservativeresults because the <strong>Doppler</strong> worth is underestimated ~30% for quadratic pr<strong>of</strong>iles. Temperature distribution effects for <strong>Doppler</strong> could be accurately accounted by the empiricalweighting scheme described by Eq. (4). LWR RIA calculated using <strong>CASMO</strong>-5 cross-section data should be milder. This means that thefuel safety parameters computed with <strong>CASMO</strong>-5 core-section data show more margin than thesame parameters computed using <strong>CASMO</strong>-4 data for PWR rod ejection accidents <strong>and</strong> BWR roddrop accidents. The prompt enthalpy rise is barely affected by the choice <strong>of</strong> the <strong>Doppler</strong> temperature definition.The under-prediction <strong>of</strong> the <strong>Doppler</strong> reactivity by the ‘NEA’ <strong>Doppler</strong> temperature results in aconservative estimate <strong>of</strong> the peak fuel enthalpy. Results computed with the ‘BE1’, ‘BE2’, <strong>and</strong>‘GDTL’ effective <strong>Doppler</strong> temperatures, differ only a few percent.PHYSOR 2010 – Advances in Reactor Physics to Power the Nuclear RenaissancePittsburgh, Pennsylvania, USA, May 9-14, 201011/13
Gerardo Gr<strong>and</strong>i et.al.Further investigation <strong>of</strong> the <strong>CASMO</strong>-5 cross-section effects shall be performed using realistic UO 2 /MOXcore designs in which the core state depends on the cross-section data set. Also, the <strong>CASMO</strong>-5 crosssectioneffects will be conducted for two other S3K mainstream applications, namely: BWR stability <strong>and</strong>fast operational transients.REFERENCES1. J. Borkowski, J. Rhodes, P. Esser, K. Smith, “Three Dimensional Transient Capability inSIMULATE-3,” Trans. Am. Nucl. Soc., 71, 456, (1994).2. G. Gr<strong>and</strong>i <strong>and</strong> K. Smith, “SIMULATE-3K Explicit Fuel Pin Modelling in RIAs,” Trans. Am. Nucl.Soc., 96, 627, (2007).3. J. L. Eller, “Application <strong>of</strong> SIMULATE-3K To PWR Reactivity Insertion Accident,” Advances inNuclear Fuel Management (ANFM 2009), Hilton Head Isl<strong>and</strong>, South Carolina, April 12-15, on CD-ROM, (2009).4. H. Ferroukhi, M.A. Zimmermann, “Study <strong>of</strong> the PWR REA Pulse Width for Realistic UO2 <strong>and</strong> MOXCore Designs using 3-D Kinetics,” Annals <strong>of</strong> Nuclear Energy, 36, pp.274-280 (2009).5. K. Smith <strong>and</strong> J. Rhodes, “<strong>CASMO</strong>-4 Characteristic Methods for Two Dimensional PWR <strong>and</strong> BWRCore Calculations,” Trans. Am. Nucl. Soc., 83, 322, (2000).6. J. Rhodes, K. Smith <strong>and</strong> D. Lee, “<strong>CASMO</strong>-5 Development <strong>and</strong> Applications,” Advances in NuclearAnalysis <strong>and</strong> Simulation (PHYSOR 2006), Vancouver, BC, Canada, September 10-14, (2006).7. D. Lee, K. Smith <strong>and</strong> J. Rhodes, “The Impact <strong>of</strong> 238 U Resonance Elastic Scattering Approximationson Thermal Reactor <strong>Doppler</strong> Reactivity,” Annals <strong>of</strong> Nuclear Energy, 36, pp.274-280 (2009).8. D. Lee, J. Rhodes, K.Smith, “Quadratic Depletion Model for Gadolinium Isotopes in <strong>CASMO</strong>-5,”Advances in Nuclear Fuel Management IV (ANFM 2009), South Carolina, April 12-15, on CD-ROM,(2009).9. A. Yamamoto, M. Tabuchi, N. Sugimura, T. Ushio And M. Mori, “Derivation <strong>of</strong> Optimum PolarAngle Quadrature Set for the Method <strong>of</strong> Characteristics Based on Approximation Error for theBickley Function,” J. Nucl. Sci. Technol., 44, pp. 129-136 (2007).10. B. Becker, R. Dagan, <strong>and</strong> G. Lohnert, “Pro<strong>of</strong> <strong>and</strong> Implementation <strong>of</strong> the Stochastic Formula for IdealGas, Energy Dependent Scattering Kernel,” Annals <strong>of</strong> Nuclear Energy, 36, pp.1170-1183 (2009).11. Y. Danon, E. Liu, D. Barry, <strong>and</strong> T. Ro, “Benchmark Experiment <strong>of</strong> Neutron Resonance ScatteringModels In Monte Carlo Codes,” International Conference on Mathematics, Computational Methods<strong>and</strong> Reactor Physics (M&C 2009), Saratoga Springs, New York, May 3-7, on CD-ROM, (2009).12. T. Kozlowski, T. J. Downar, “The PWR MOX/UO2 Core Transient Benchmark, Final Report”,NEA/NSC/DOC(2006)20.13. A. O. Goltsev et al, “The Influence <strong>of</strong> a Non-Uniform Radial Temperature Distribution in the Fuel onthe Results <strong>of</strong> Calculations <strong>of</strong> Transients,” Annals <strong>of</strong> Nuclear Energy, 30, pp.1135-1153 (2003).14. D.D. Lanning, et al., “FRAPCON-3 Updates,” NUREG/CR-6534, Vol. 4, PNL-11513, (2005).15. G. Gr<strong>and</strong>i <strong>and</strong> D. Hagrman, “Improvements to the INTERPIN Code for High Burnup <strong>and</strong> MOXFuel,” Trans. Am. Nucl. Soc., 96, 614-615, (2007).16. G. Gr<strong>and</strong>i, “<strong>Effect</strong> <strong>of</strong> the Discretization <strong>and</strong> Neutronic Thermal Hydraulic Coupling on LWRTransients,” Proceedings <strong>of</strong> the 13 th International Topical Meeting on Nuclear Reactor ThermalHydraulics (NURETH-13), Kanazawa, Ishikawa-Ken, Japan, September 27-October 2, on CD-ROM,(2009).PHYSOR 2010 – Advances in Reactor Physics to Power the Nuclear RenaissancePittsburgh, Pennsylvania, USA, May 9-14, 201012/13
<strong>Effect</strong> <strong>of</strong> <strong>CASMO</strong>-5 <strong>Cross</strong>-<strong>Section</strong> <strong>Data</strong> <strong>and</strong> <strong>Doppler</strong> Temperature Definitions on LWR Reactivity Initiated AccidentsAPPENDIX A: EFFECTIVE DOPPLER TEMPERATURE PROBLEMThe geometry consists <strong>of</strong> a single pin-cell in a square lattice. The fuel is UO 2 fuel, 3.527 % enriched,density 10.2 g/cm 3 . The cladding is Zirconium, density 6.550 g/cm 3 . The coolant is water, density 0.7116g/cm 3 . The outer fuel pellet radius is 0.410 cm, the outer clad radius 0.475 cm <strong>and</strong> the pin pitch 1.26 cm.The fuel pellet was divided into 9 equal volume rings.Six cases were examined using this geometry. Case 1 consists <strong>of</strong> flat temperature pr<strong>of</strong>ile within a pin athot zero power conditions. Cases 2 <strong>and</strong> 3 are flat temperature pr<strong>of</strong>iles at normal <strong>and</strong> high powerconditions respectively. Cases 4 <strong>and</strong> 5 represent quadratic temperature pr<strong>of</strong>iles at normal <strong>and</strong> high powerconditions. Finally, in case 6, the temperature resembles the intra-pellet power distribution in a highburned pellet. In all cases the cladding <strong>and</strong> coolant temperatures are assumed to be 450 K. Table VIsummarizes the conditions for each <strong>of</strong> the test cases. The alternative effective <strong>Doppler</strong> temperatures,computed using the equations in section 3, are also provided for completeness.Table VI: Fuel Temperature DefinitionsAverage Temperature (K)<strong>Doppler</strong>Temperatures(K)Surface Temp. (K)Average Temp. (K)Centerline Temp. (K)Ring 1 450 900 1350 1300 2150 1200Ring 2 450 900 1350 1200 1950 1200Ring 3 450 900 1350 1100 1750 1200Ring 4 450 900 1350 1000 1550 1260Ring 5 450 900 1350 900 1350 1300Ring 6 450 900 1350 800 1150 1350Ring 7 450 900 1350 700 950 1400Ring 8 450 900 1350 600 750 1440Ring 9 450 900 1350 500 550 1800BE1 (Eq. 1)NEA (Eq. 2)GDTL (Eq. 3)BE2 (Eq. 4)Case 1 Case 2Case 3 Case 4 Case 5 Case 6450 900 1350 450 450 1800450 900 1350 900 1350 1350450 900 1350 1350 2250 1200450450450900900450 9009001350135013509007201350 86086313509901276135016201238 13391387The results are used to determine the effect <strong>of</strong> including the temperature pr<strong>of</strong>ile across the pin, <strong>and</strong> todetermine an appropriate weighting scheme in a steady state or transient nodal simulator. By comparingthe differences between Cases 2 <strong>and</strong> 4, Cases 3 <strong>and</strong> 5, <strong>and</strong> Cases 3 <strong>and</strong> 6 one can determine the impact <strong>of</strong>correctly modeling the temperature distribution.PHYSOR 2010 – Advances in Reactor Physics to Power the Nuclear RenaissancePittsburgh, Pennsylvania, USA, May 9-14, 201013/13


