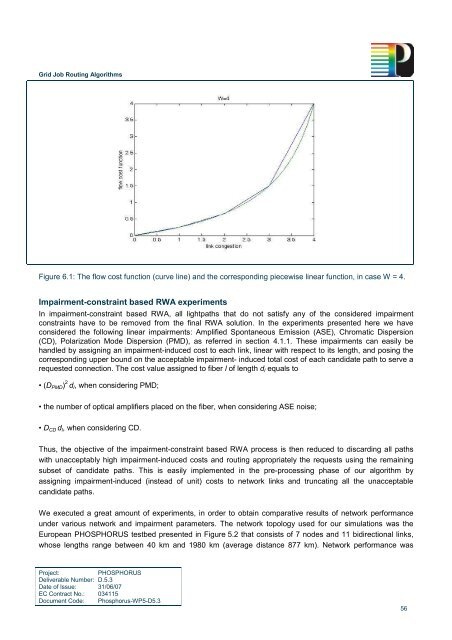
<strong>Grid</strong> <strong>Job</strong> <strong>Routing</strong> <strong>Algorithms</strong>Figure 6.1: The flow cost function (curve line) and the corresponding piecewise linear function, in case W = 4.Impairment-constraint based RWA experimentsIn impairment-constraint based RWA, all lightpaths that do not satisfy any of the considered impairmentconstraints have to be removed from the final RWA solution. In the experiments presented here we haveconsidered the following linear impairments: Amplified Spontaneous Emission (ASE), Chromatic Dispersion(CD), Polarization Mode Dispersion (PMD), as referred in section 4.1.1. These impairments can easily behandled by assigning an impairment-induced cost to each link, linear with respect to its length, and posing thecorresponding upper bound on the acceptable impairment- induced total cost of each candidate path to serve arequested connection. The cost value assigned to fiber l of length d l equals to• (D PMD ) 2 d l , when considering PMD;• the number of optical amplifiers placed on the fiber, when considering ASE noise;• D CD d l , when considering CD.Thus, the objective of the impairment-constraint based RWA process is then reduced to discarding all pathswith unacceptably high impairment-induced costs and routing appropriately the requests using the remainingsubset of candidate paths. This is easily implemented in the pre-processing phase of our algorithm byassigning impairment-induced (instead of unit) costs to network links and truncating all the unacceptablecandidate paths.We executed a great amount of experiments, in order to obtain comparative results of network performanceunder various network and impairment parameters. The network topology used for our simulations was theEuropean PHOSPHORUS testbed presented in Figure 5.2 that consists of 7 nodes and 11 bidirectional links,whose lengths range between 40 km and 1980 km (average distance 877 km). Network performance wasProject:PHOSPHORUSDeliverable Number: D.5.3Date of Issue: 31/06/07EC Contract No.: 034115Document Code: <strong>Phosphorus</strong>-WP5-D5.356
<strong>Grid</strong> <strong>Job</strong> <strong>Routing</strong> <strong>Algorithms</strong>measured through the use of the average blocking probability of 100 RWA executions corresponding todifferent random static traffic instances of a given traffic load. W was fixed to 4 and k was equal to 3; thesevalues suffice for almost all RWA random instances of traffic load 0.2 and in absence of impairment constraintsto be executed with 100% throughput. The blocking probability presented in the following sections is theaverage blocking probability of the experiments in which the solution of the proposed LP formulation wasinteger. Thus, the blocking probability is affected only by the physical impairments of the network. Finally, nowavelength conversion was considered to be available. All experiments were executed in MATLAB. For LPsolving,the GLPK-4.8 MATLAB library [glpk] was utilized.PMD studiesIn our studies, all network fibers are considered of the same type. RWA simulations were executed for D PMDvalues ranged in 0.05−0.6 ps / km (small values correspond to newer fibers, while big values correspond toolder ones), bit rates of B 10, 20, 30 and 40 Gbps and traffic loads of 10, 20, 30 and 40 percent of the numberof the total possible connections. Figure 6.2 shows, that the PMD effect seems negligible at 10 Gbps for fiberswith D PMD values less than 0.25 ps / km (which is a typical value for modern fibers). However, at higher bitrates the situation is much worsened, especially when dealing with older fibers. At bit rates of 20, 30 and 40Gbps, the corresponding curves rise (where the network’s throughput starts to divert from 100%) at the criticalD PMD values of 0.15, 0.1 and 0.1 ps / km , respectively. This is explained as follows: these B-D PMD pairs leadto the same approximate maximum acceptable (due to PMD) path length of 625 km and there are only fewpaths in the topology under consideration that satisfy this constraint. At bit rates of 30 and 40 Gbps, the curvesalmost reach the exceptionable blocking probability value of 100% at the critical PMD parameter values of 0.55and 0.4 ps / km , respectively; these B-D PMD pairs lead to the same approximate maximum acceptable pathlength of 39 km which is smaller than the minimum link length of 40km (Figure 5.2). Notice that the blockingprobability value of each bit rate curve is close to zero when the PMD parameter equals to 0.1 ps / km , andzero for 0.05 ps /km , denoting that newer fibers are able to compensate totally the PMD effect in ourexperimental network, even when utilizing bit rates of 40 Gbps.ASE noise studiesIn our studies, all network fibers are considered to be of the same type; thus, they are characterized by thesame attenuation coefficient value a. Assume, also, that optical amplifiers of the same type (characterized bycommon gains G and common noise figures) are placed on networks’ nodes and fibers in the following uniformway: one optical amplifier is placed on each network node and one optical amplifier is placed on each (G/a)kilometres of fiber. The values used are P avg =4 dBm (equal to 2.5 mW), a = 0.25 dB/km and hvB 0 = −58 dBm.We executed a great amount of RWA simulations for n sp values ranged at 1.5−5 (corresponding to amplifiers ofvarious noise figures), amplifier gain values of 17.5, 20, 22.5 and 25 dB and traffic loads of 10, 20, 30 and 40percent of the number of the total possible connections. We considered both scenarios where FEC was notused (corresponding to SNR min =25 dB) and FEC was used (corresponding to SNR min =20 dB).Project:PHOSPHORUSDeliverable Number: D.5.3Date of Issue: 31/06/07EC Contract No.: 034115Document Code: <strong>Phosphorus</strong>-WP5-D5.357