- Page 1 and 2: GUIDE TO LEADING Policies, PRACTICE
- Page 3 and 4: GUIDE TO LEADINGPOLICIES, PRACTICES
- Page 5 and 6: AcknowledgementsFirst and foremost,
- Page 7 and 8: Part IV 1001In Support of the Emplo
- Page 10: art IWhat This Guide DoesThe “Gui
- Page 15 and 16: Setting the ContextThis section is
- Page 17: to work and to be economically enga
- Page 21 and 22: ▶Health and Wellness Implications
- Page 23 and 24: ment directly, e.g., the Veterans
- Page 25 and 26: credit, the veteran may transition
- Page 27 and 28: Ultimately, employment is a key to
- Page 29 and 30: “Veterans are exceptionalindividu
- Page 31 and 32: ue patterns of education and traini
- Page 33 and 34: well, requiring affirmative steps t
- Page 35 and 36: during a single 12-month period to
- Page 37 and 38: guide to leading policies, practice
- Page 39 and 40: In Part II of this publication we h
- Page 41 and 42: Research studies focused on both mi
- Page 43 and 44: ▶Veterans Have Experience/Skillin
- Page 45 and 46: those efforts, New York State has m
- Page 47 and 48: 3. Employer Challenge: Skills Trans
- Page 49 and 50: Recommendations & Resources:▶ MOS
- Page 51 and 52: ▶ Executive-level engagement prom
- Page 53 and 54: 5. Employer Challenge: TrackingVete
- Page 55 and 56: Strategies for Tracking Veterans in
- Page 57 and 58: To create a veteran-engaged culture
- Page 59 and 60: tion, as well as encouragement and
- Page 61 and 62: ▶ When the veteran is hired, make
- Page 63 and 64: In response to calls from employers
- Page 65 and 66: in the firm, and is physically assi
- Page 67 and 68: personnel to become better educated
- Page 69 and 70:
.Additional Leading PracticeExample
- Page 71 and 72:
ing, and career coaching and mentor
- Page 73 and 74:
In the context of this research and
- Page 75 and 76:
2. Leading Practices: Training andP
- Page 77 and 78:
VETalent is expanding, and Prudenti
- Page 79 and 80:
utilize these shadowing opportuniti
- Page 81 and 82:
C. Summarysuch programs to include
- Page 83 and 84:
▶ A Transfer Guide: Understanding
- Page 85 and 86:
Leading Practices Models:WalmartSca
- Page 87:
An internal network of military vet
- Page 91 and 92:
support for injured veterans, manag
- Page 93 and 94:
is to serve as a company resource o
- Page 95 and 96:
surviving parents, spouses, childre
- Page 97 and 98:
Challenges to Implementation andSca
- Page 99 and 100:
.▶ Furthermore, Walmart believest
- Page 101 and 102:
▶ American Corporate Partners (AC
- Page 103 and 104:
5. Teaming and Developing Small Bus
- Page 105 and 106:
▶ JPMC’s Supplier Diversity Net
- Page 107 and 108:
▶ Expand the presence of diverses
- Page 109 and 110:
1. In Support of the Employer: Issu
- Page 111 and 112:
TABLE 1:Summary of BLS Employment S
- Page 113 and 114:
figure 1:Unemployment Rates by Vete
- Page 115 and 116:
table 3:Unemployment Rate of Vetera
- Page 117 and 118:
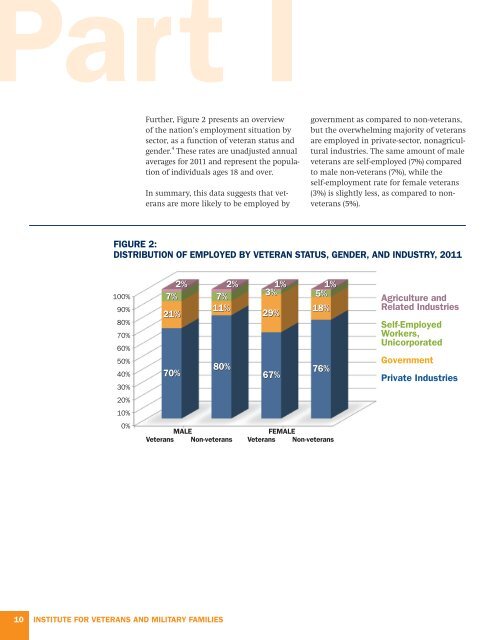
figure 2: Number of Unemployed Vete
- Page 119 and 120:
UNEMPLOYME40%30%UNEMPLOFIGURE Afric
- Page 121 and 122:
elationships with family, and 44% f
- Page 123 and 124:
0%0%0%0%0%0%0%0%0%0%0%0%figure 6:So
- Page 126 and 127:
art IVAccess to HealthcareAccess to
- Page 128 and 129:
art IVResearchers have found that e
- Page 130 and 131:
art IV▶ ADA Disability and Busine
- Page 132 and 133:
art IVstudy that examined the preva
- Page 134 and 135:
art IV▶ Vision ImpairmentsThe Nat
- Page 136 and 137:
ummaryFor the better part of the pa
- Page 138 and 139:
AppendicesThe following resources,
- Page 140 and 141:
AppendicesAppendix B:Checklist for
- Page 142 and 143:
AppendicesAppendix D:Checklist for
- Page 144 and 145:
Appendices▶ The Veterans Opportun
- Page 146 and 147:
AppendicesPrivate Sector Initiative
- Page 148 and 149:
Appendices▶ Ryder System Inc., a
- Page 150 and 151:
AppendicesAppendix G:Summary of Sta
- Page 152 and 153:
Appendices144 INSTITUtE FOR veteran
- Page 154 and 155:
Appendicesof the education and expe
- Page 156 and 157:
CitationsPART I1Krier, D., Stockner
- Page 158 and 159:
Citations22Rodriguez, E., Lasch, K.
- Page 160 and 161:
Citations7Disability Case Study Res
- Page 162 and 163:
Citations14Student Veterans of Amer
- Page 164 and 165:
Citations43CSX Corporation Inc. (20
- Page 166 and 167:
Citations74Merrill Lynch (2008). Su
- Page 168 and 169:
Citations11Hall, R.E. (1972). Turno
- Page 170 and 171:
Citations38Kulka, R.A., Schlenger,
- Page 172:
700 University Avenue, Suite 303Syr