

002 Sinus Rhythm, atrial rate 90 Mobitz II - Blaufuss Multimedia
002 Sinus Rhythm, atrial rate 90 Mobitz II - Blaufuss Multimedia
002 Sinus Rhythm, atrial rate 90 Mobitz II - Blaufuss Multimedia

Create successful ePaper yourself
Turn your PDF publications into a flip-book with our unique Google optimized e-Paper software.
Copyright © 2006 <strong>Blaufuss</strong> <strong>Multimedia</strong>. All rights reserved. Page 1<br />
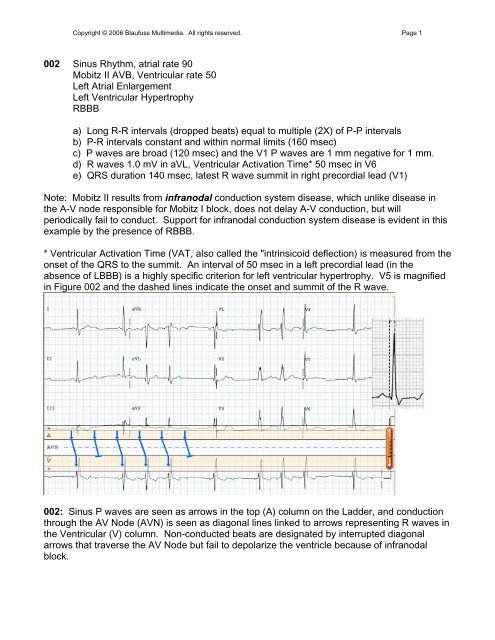
<strong>002</strong> <strong>Sinus</strong> <strong>Rhythm</strong>, <strong>atrial</strong> <strong>rate</strong> <strong>90</strong><br />
<strong>Mobitz</strong> <strong>II</strong> AVB, Ventricular <strong>rate</strong> 50<br />
Left Atrial Enlargement<br />
Left Ventricular Hypertrophy<br />
RBBB<br />
a) Long R-R intervals (dropped beats) equal to multiple (2X) of P-P intervals<br />
b) P-R intervals constant and within normal limits (160 msec)<br />
c) P waves are broad (120 msec) and the V1 P waves are 1 mm negative for 1 mm.<br />
d) R waves 1.0 mV in aVL, Ventricular Activation Time* 50 msec in V6<br />
e) QRS duration 140 msec, latest R wave summit in right precordial lead (V1)<br />
Note: <strong>Mobitz</strong> <strong>II</strong> results from infranodal conduction system disease, which unlike disease in<br />
the A-V node responsible for <strong>Mobitz</strong> I block, does not delay A-V conduction, but will<br />
periodically fail to conduct. Support for infranodal conduction system disease is evident in this<br />
example by the presence of RBBB.<br />
* Ventricular Activation Time (VAT, also called the "intrinsicoid deflection) is measured from the<br />
onset of the QRS to the summit. An interval of 50 msec in a left precordial lead (in the<br />
absence of LBBB) is a highly specific criterion for left ventricular hypertrophy. V5 is magnified<br />
in Figure <strong>002</strong> and the dashed lines indicate the onset and summit of the R wave.<br />
<strong>002</strong>: <strong>Sinus</strong> P waves are seen as arrows in the top (A) column on the Ladder, and conduction<br />
through the AV Node (AVN) is seen as diagonal lines linked to arrows representing R waves in<br />
the Ventricular (V) column. Non-conducted beats are designated by interrupted diagonal<br />
arrows that traverse the AV Node but fail to depolarize the ventricle because of infranodal<br />
block.
Copyright © 2006 <strong>Blaufuss</strong> <strong>Multimedia</strong>. All rights reserved. Page 2<br />
009 <strong>Sinus</strong> <strong>Rhythm</strong>, <strong>atrial</strong> <strong>rate</strong> 65<br />
<strong>Mobitz</strong> <strong>II</strong> AVB, ventricular <strong>rate</strong> 65*<br />
*Junctional Escape beats "compensate" for non-conducted beats<br />
Anteroseptal Myocardial Infarction, recent<br />
Bifascicular Block (RBBB and Posterior Fascicular Block)<br />
a) P-R intervals 180 msec and constant prior to dropped beats<br />
b) Escape beats resemble native beats, therefore junctional in origin<br />
c) Beats following escape beats are conducted from P waves hidden in T wave<br />
d) Q waves and ST elevations in V1-4 indicate evolving infarction<br />
e) QRS duration 160 msec, latest R wave summit in right precordial lead (V1)<br />
combined with right axis deviation in frontal plane indicate bifascicular block.<br />
Note: Infranodal conduction system disease in association with a myocardial infarction<br />
suggests that the ischemic process has penet<strong>rate</strong>d deep within the interventricular septum.<br />
The variation in height of the R waves in the right precordial leads results from different<br />
degrees of recovery of the right bundle branch depending on the preceding R-R interval--the R<br />
waves are tallest when the R-R interval is shortest in the conducted beat following the escape<br />
beat. The prolongation of the P-R intervals in the beats following the escape beats results<br />
from the relatively recent activation of the AV node by the junctional escape focus.<br />
*Junctional escape beats usually occur at fixed intervals, but in this instance the escape<br />
intervals are 1410 and1360 msec. The differing rhythms preceding each of the dropped beats<br />
reset the escape focus at different times. The interval between the non-conducted P waves<br />
and the junctional beats is constant (650 msec).<br />
009: A junctional escape beat is noted on the Ladder by (*). The calipers set to the P-P<br />
interval locate a P wave superimposed on the T wave. AV conduction is prolonged by 40 msec<br />
(shallower slope) when the R-P interval is short following the junctional escape beat.
Copyright © 2006 <strong>Blaufuss</strong> <strong>Multimedia</strong>. All rights reserved. Page 3<br />
014 <strong>Sinus</strong> Tachycardia, <strong>atrial</strong> <strong>rate</strong> 120<br />
Third degree A-V Block*<br />
Junctional (or His Bundle) Escape <strong>Rhythm</strong>, <strong>rate</strong> 58<br />
Inferior Wall Injury or Infarction<br />
Anterior Ischemia<br />
a) Every other P wave is partially hidden in the T waves.<br />
b) The A and V <strong>rate</strong>s are constant and almost 2:1, but the P-R relationship varies<br />
c) QRS complexes are narrow, therefore supraventricular (or His) in origin<br />
d) Inferior lead S-T segments are minimally elevated with T inversions and<br />
reciprocal S-T depressions in I and aVL.<br />
e) T waves symmetrically inverted in V1-4<br />
Note: The rapidity of the sinus <strong>rate</strong> suggests that this rhythm is a result of an acute, poorly<br />
tole<strong>rate</strong>d process. The S-T elevations in the inferior leads and reciprocal depressions in I and<br />
aVL indicate injury or infarction of the inferior wall, which could provide a mechanism for the<br />
high degree of A-V block, e.g., the Bezold-Jarisch reflex. This vagotonic reflex is activated by<br />
stretch receptors in the inferior left ventricular wall, and can result in varying degrees of A-V<br />
block that is usually, but not always transient.<br />
014: Alternate P waves are partially obscured in the T waves but can be seen clearly in Lead<br />
<strong>II</strong>. Although there is P-R proximity that suggests AV conduction, the constant R-R intervals,<br />
and changing P-R relationships throughout the strip belie any <strong>atrial</strong> influence on the ventricles.<br />
*Although none of the P waves conduct, it could be argued that none of the P waves were<br />
permitted to conduct because they were either preempted by depolarization from a junctional<br />
rhythm or occurred in the refractory period within the preceding T wave. Other ECGs in this<br />
patient demonst<strong>rate</strong>d complete A-V dissociation despite differing P and QRS relationships.
Copyright © 2006 <strong>Blaufuss</strong> <strong>Multimedia</strong>. All rights reserved. Page 4<br />
019 Atrial Bigeminy (<strong>Sinus</strong> <strong>Rhythm</strong> Alternating with Atrial Premature Complexes), <strong>rate</strong> 82.<br />
Early precordial R-wave transition<br />
a) Alternating complexes follow 860 msec and 610 msec intervals.<br />
b) There are 2 populations of P waves followed by...<br />
c) Alternating P-R intervals of 180 and 240 msec<br />
d) Precordial lead R waves exceed S waves in V2--a nonspecific finding that could<br />
result from right ventricular hypertrophy, posterior infarction or septal fascicular block.<br />
Note: Atrial Premature Complexes (APCs, marked by asterisks on the Ladder) are usually<br />
followed by a pause that is less than a compensatory pause* because, unlike ventricular<br />
premature complexes, <strong>atrial</strong> premature beats reset the sinus node. The pause results from the<br />
transit time required to enter the sinus node and reset it, followed by the time required for the<br />
ensuing sinus discharge to traverse the sino-<strong>atrial</strong> junction to depolarize the atria. Thus the<br />
entrance and exit transit times are added to the interval between the P waves.<br />
*Compensatory pauses are seen following most ventricular premature complexes, and result<br />
from the lack of any influence on the sinus node -- the sinus node acts as a metronome to<br />
keep the keep the beat following the premature beat on schedule. The premature beat occurs<br />
early by definition, and the ensuing sinus beat is late by the same time interval that the<br />
premature beat was early. For example, if a premature beat is 400 msec early, the postextrasystolic<br />
beat "compensates" by occurring 400 msec late. The sum of these two intervals<br />
equals 2 normal sinus cycles for that patient. Compensatory pauses are seen in ECG 324<br />
(click on Menu to select that ECG).<br />
019: Alternate P wave arrows in the <strong>atrial</strong> (A) column are designated with asterisks (*)<br />
indicating an ectopic focus. The alternating sinus and ectopic P waves exhibit subtle<br />
differences in P wave morphology in the limb leads. The resulting rhythm closely resembles<br />
that seen in ECG 027, but in the latter case the alternate P waves have constant morphology.
Copyright © 2006 <strong>Blaufuss</strong> <strong>Multimedia</strong>. All rights reserved. Page 5<br />
027 Sino-Atrial Wenckebach (<strong>Mobitz</strong> I) Exit Block, <strong>rate</strong> 76<br />
Recent Inferior Wall Myocardial Infarction<br />
Early Precordial Transition (consider Posterior Infarction)<br />
a) Alternating long (930 msec) and short (630 msec) intervals<br />
b) Constant P-R intervals (200 msec)<br />
c) Q waves and ST elevations in inferior leads (<strong>II</strong>, <strong>II</strong>I, aVF)<br />
d) Reciprocal ST depressions in leads I and aVL<br />
e) R>S in V2, >40 msec<br />
Note: The rhythm disturbance bears the "footprints of Wenckebach," in which the pauses are<br />
less than twice the length of the shortest intervals, but differs from A-V Wenckebach in that<br />
both <strong>atrial</strong> and ventricular complexes "drop out" and the P-R intervals remain constant. This<br />
recording also resembles the previous tracing (019) in which there are alternating short and<br />
long intervals, but the P wave morphology is the same on all beats in 027 suggesting that the<br />
P waves all arise from the same focus, namely the sinus node. The Ladder has been modified<br />
to depict decremental conduction in the sino-<strong>atrial</strong> junction leading to a 3:2 conduction block<br />
from the sinus node to the atrium. The setting in which this rhythm occurs (inferior wall<br />
infarction) suggests that the Bezold-Jarisch Reflex is responsible.<br />
027: The Ladder designations have been modified to represent the sinus node, the sino-<strong>atrial</strong><br />
junction, and the atrium in order to demonst<strong>rate</strong> the decremental conduction occurring at the<br />
level of the SA junction preceding the dropped beats, resulting in "the footprints of<br />
Wenckebach." The timing of sinus node depolarization was calculated by dividing the interval<br />
between every other P wave by 3 (2 + 1 = 3) so that 3:2 conduction could be plotted. The<br />
identical configuration of all P waves can be contrasted with the alternate P waves in ECG<br />
019, but the resulting "bigeminal" rhythm (defined as "group beating by twos") is almost<br />
identical.
Copyright © 2006 <strong>Blaufuss</strong> <strong>Multimedia</strong>. All rights reserved. Page 6<br />
031 <strong>Sinus</strong> Tachycardia, <strong>atrial</strong> <strong>rate</strong> 118<br />
<strong>Mobitz</strong> I (Wenckebach) A-V Block, ventricular <strong>rate</strong> 72<br />
Acute Infero-posterior Myocardial Infarction<br />
Left Atrial Enlargement<br />
a) Longest R-R intervals less than 2X the shortest<br />
b) AV Block (2:1, 3:2) with decremental conduction (P-R prolongs before failure to<br />
conduct).<br />
c) Q waves in <strong>II</strong>, <strong>II</strong>I and aVF with S-T elevations denote acute inferior wall MI<br />
d) Prominent R with S-T depression in right precordial leads depict acute posterior MI<br />
e) Negative P wave deflections >40 msec and 0.1 mV indicate left <strong>atrial</strong> enlargement<br />
Note: This ECG was part of a series that exhibited different manifestations of the Bezold-<br />
Jarisch reflex during evolution of an acute infero-posterior myocardial infarction (see 040).<br />
031: The partially obscured P waves can be found by setting the calipers to fit visible 2 P<br />
wave intervals and swiveling the calipers to the right and left. After finding the P waves, sinus<br />
tachycardia is indicated by closely spaced arrows in the <strong>atrial</strong> column, and decremental<br />
conduction is seen in the slope of the lines connecting the <strong>atrial</strong> and ventricular depolarizations<br />
exhibiting 3:2 and 2:1 (n/n-1) conduction. The injury current (ST elevation) and Q waves in <strong>II</strong>,<br />
<strong>II</strong>I, and aVF establish an evolving inferior wall infarction, while the tall R waves and ST<br />
depressions in right precordial leads indicate posterior wall involvement as well.
Copyright © 2006 <strong>Blaufuss</strong> <strong>Multimedia</strong>. All rights reserved. Page 7<br />
040 <strong>Sinus</strong> Tachycardia, <strong>atrial</strong> <strong>rate</strong> 116<br />
Third Degree A-V Block, ventricular <strong>rate</strong> 57<br />
Acute Infero-posterior Myocardial Infarction<br />
Left Atrial Enlargement<br />
a) Ventricular rhythm is regular and unaffected by relationship to P waves<br />
b) P-R "relationships" suggest 2:1 conduction, but drift is seen over 10 seconds<br />
c) Q waves in <strong>II</strong>, <strong>II</strong>I and aVF with S-T elevations denote acute inferior wall MI<br />
d) Prominent R with S-T depression in right precordial leads depict acute posterior MI<br />
e) Negative P wave deflections >40 msec and 0.1 mV indicate left <strong>atrial</strong> enlargement<br />
Note: Compare the relationship between the P and QRS in the first and last complexes. The<br />
subtle drifting apart of the <strong>atrial</strong> and ventricular complexes may be overlooked by focusing on<br />
adjacent complexes, but is obvious when comparing the first and last beats. Both the P-P and<br />
R-R intervals are constant. The junctional origin of ventricular depolarization is indicated by the<br />
asterisks (*) in the Ladder Diagram and supported by the similarity with the conducted QRS<br />
complexes in 030.<br />
040: At first glance this ECG appears to show first degree AV block because of the wide<br />
separation of visible P waves from the ensuing QRS complexes. However partially obscured P<br />
waves can be located by setting calipers at ½ the interval between clearly visible P waves,<br />
revealing sinus tachycardia at about twice the ventricular <strong>rate</strong>. The juxtaposition of alternate P<br />
waves to every QRS complex suggests 2:1 conduction, but the relationship is inexact,<br />
changing progressively from 240 to 340 msec in the first to the last complexes on the rhythm<br />
strip. This subtle variation in PR relationships (not actual PR intervals) results from the<br />
junctional escape <strong>rate</strong> (57) being slightly less than half the <strong>atrial</strong> <strong>rate</strong> (116).
Copyright © 2006 <strong>Blaufuss</strong> <strong>Multimedia</strong>. All rights reserved. Page 8<br />
056 <strong>Sinus</strong> Arrhythmia, <strong>atrial</strong> <strong>rate</strong> 54-68<br />
Accele<strong>rate</strong>d Junctional <strong>Rhythm</strong>, <strong>rate</strong> 58<br />
Resulting in Atrioventricular Dissociation<br />
056: The R-R intervals are constant and indicate a <strong>rate</strong> of 58 bpm until the last QRS, which is<br />
preceded by a P wave indicating "ventricular capture" by the atrium. The next-to-last QRS is<br />
also preceded by a P wave, but it has the same R-R interval of the preceding beats. The<br />
relationship between P and QRS complexes varies; some Ps occur within the QRS.<br />
056: The P waves are hidden in the QRS, but emerge as the <strong>atrial</strong> <strong>rate</strong> accele<strong>rate</strong>s.<br />
Asterisks (*) on the Ladder indicate junctional origin of 8 out of 10 QRS complexes.
Copyright © 2006 <strong>Blaufuss</strong> <strong>Multimedia</strong>. All rights reserved. Page 9<br />
Note: This manifestation of A-V Dissociation is not a result of A-V Block, as evidenced by the<br />
ability of the last P wave on the strip to capture (conduct to) the ventricle with a normal P-R<br />
interval (160 msec). Many of the P waves are superimposed upon the QRS complexes in the<br />
middle of the strip. The proof of conduction is the abrupt change in the previously constant R-R<br />
interval when the P wave is appropriately timed as the atrium accele<strong>rate</strong>s and exceeds the<br />
junctional <strong>rate</strong>.<br />
The following algorithm summarizes the broad spectrum of rhythms exhibiting A-V<br />
Dissociation, with the rhythm in 056 highlighted.<br />
On the left side of the algorithm, the <strong>atrial</strong> <strong>rate</strong> exceeds the ventricular <strong>rate</strong> as a result of AV<br />
Block. When the ventricular <strong>rate</strong> exceeds and/or is independent of the <strong>atrial</strong> <strong>rate</strong>, mechanisms<br />
other than block are responsible as shown on the right. In 056, sinus arrhythmia allowed the<br />
<strong>atrial</strong> <strong>rate</strong> to fall below the intrinsic junctional <strong>rate</strong>, so the junction took over until the <strong>atrial</strong> <strong>rate</strong><br />
accele<strong>rate</strong>d and overtook the junctional <strong>rate</strong>. The junctional <strong>rate</strong> of 58 is near the upper <strong>rate</strong><br />
limit for an "escape" rhythm and may be considered "usurpation" by an accele<strong>rate</strong>d junctional<br />
rhythm.
Copyright © 2006 <strong>Blaufuss</strong> <strong>Multimedia</strong>. All rights reserved. Page 10<br />
074 Coarse Atrial Fibrillation<br />
Rapid Ventricular Response, ventricular <strong>rate</strong> 120<br />
Aberrant Ventricular Conduction ("Ashman Phenomenon")<br />
Left Ventricular Hypertrophy<br />
a) Atrial activity rapid (>300) and irregular in <strong>rate</strong> and morphology<br />
b) Ventricular response rapid and irregular (R-R 340-750 msec, 80-176 bpm)<br />
c) Aberrant (RBBB) QRS complexes following "long-short sequences"<br />
d) R wave in V5 2.8 mV<br />
Note: In this example intermittent aberrancy (wide QRS complexes exhibiting right bundle<br />
branch block) is not due to absolute prematurity (shortest prior R-R interval), but rather<br />
"relative prematurity" in that there is a long, followed by a (relatively) short R-R interval leading<br />
to the aberrant complexes. Since the duration of the refractory period of the right bundle is<br />
proportional to the length of the previous R-R interval, a relatively short R-R interval<br />
immediately following a long R-R will encounter a refractory right bundle and produce an<br />
aberrant complex.<br />
074: The <strong>atrial</strong> <strong>rate</strong> is rapid and the rhythm is irregular, typical of <strong>atrial</strong> fibrillation with rapid<br />
ventricular response. Two QRS complexes exhibit RBBB in the V1 rhythm strip, both<br />
preceded by a long-short interval sequence. These aberrant beats are called "Ashman Beats"<br />
and result from an increase in the refractory period of the right bundle branch following a long<br />
preceding R-R interval. Other R-R intervals on this ECG are actually shorter (as shown) but<br />
the right bundle branch refractory period has not been prolonged by a preceding long R-R and<br />
conduction is normal. The ventricular <strong>rate</strong> (120) was determined by measuring the number of<br />
R-R intervals occurring within 6 seconds (12) and multiplying by 10 (6s X 10 = 1 minute). It is<br />
preferable to calculate <strong>rate</strong>, particularly if the rhythm is irregular, by taking a large "bite" rather<br />
than by "counting little squares." A 150 mm ruler facilitates a 6 second sample. The width of a<br />
standard ECG recording is 10 seconds, and 20 R-R intervals are seen here, so the <strong>rate</strong> is 120.
Copyright © 2006 <strong>Blaufuss</strong> <strong>Multimedia</strong>. All rights reserved. Page 11<br />
076 <strong>Sinus</strong> <strong>Rhythm</strong>, <strong>atrial</strong> <strong>rate</strong> 54<br />
<strong>Mobitz</strong> I (Wenckebach) A-V Block, ventricular <strong>rate</strong> 42<br />
Left Ventricular Hypertrophy with secondary ST-T changes<br />
a) "Footprints of Wenckebach":<br />
- Decremental conduction (P-R prolongs before non-conducted beat)<br />
- Longest R-R intervals (non-conducted beat) less than twice shortest R-R<br />
- R-R shortens as P-R lengthens (see diagram*)<br />
b) LVH Voltage (Cornell Criterion: R aVL+ S V3 = 2.5 mV) with ST-T changes<br />
Note: The slow <strong>atrial</strong> <strong>rate</strong> suggests that this rhythm is chronic and well tole<strong>rate</strong>d. The longest<br />
RR interval (2080 msec) is less than twice the shortest RR interval (1095 msec) because the<br />
pause begins with the longest PR prolongation (last conducted beat) and ends with the<br />
resumption of conduction and the shortest PR interval.<br />
076: <strong>Mobitz</strong> I (Wenckebach) second degree block is indicted by the prolonging P-R intervals.<br />
*In "classical Wenckebach" the R-R shortens (<strong>90</strong>0 to 825 msec) as the P-R lengthens because<br />
the delta P-R progressively decreases (100 to 25 msec) despite the absolute P-R increase.
Copyright © 2006 <strong>Blaufuss</strong> <strong>Multimedia</strong>. All rights reserved. Page 12<br />
078 "Atypical" Atrial Flutter, <strong>rate</strong> 200<br />
"Physiological" A-V Nodal Block, ventricular <strong>rate</strong> <strong>90</strong><br />
Right Bundle Branch Block<br />
Nonspecific ST-T changes<br />
a) Atrial rhythm rapid and regular<br />
b) Variable AV conduction (<strong>Mobitz</strong> I) with irregular ventricular response<br />
c) Flat T waves over left ventricular leads<br />
Note: The <strong>atrial</strong> rhythm is regular and rapid, but at the lower limit for <strong>atrial</strong> flutter (range 200-<br />
400) but can be slowed by antiarrhythmic drugs. The regular undulations in the baseline<br />
suggest continuous cyclic depolarization typical of flutter. The mechanism underlying flutter* is<br />
"macro-reentry" in contrast to the repeated firing from an ectopic focus in <strong>atrial</strong> tachycardia.<br />
AV block is invoked during rapid <strong>atrial</strong> arrhythmias in the atrioventricular node, and is<br />
characterized by a Wenckebach pattern that can be seen by the varying flutter wave-to-QRS<br />
intervals. This decremental conduction from alternate flutter waves can be best seen at the<br />
beginning of the recording; the QRS complexes can be seen to move farther from the<br />
conducting flutter wave before being completely blocked. The flutter is again conducted 2:1<br />
with subtle increases in the conduction interval in the 4 th through 6 th conducted beats.<br />
* The macro-reentry mechanism underlying "typical" <strong>atrial</strong> flutter is illust<strong>rate</strong>d in the SVT<br />
Tutorial elsewhere on this website. Click on SVT Tutorial/Contents/Atrial Flutter. This<br />
example is termed "atypical" because of the relatively slow <strong>rate</strong> and the inferior leads do not<br />
exhibit the classical saw-tooth appearance resulting from the classical counter-clockwise<br />
reentry loop through the isthmus area within the right atrium shown in the Tutorial.<br />
078: The <strong>atrial</strong> <strong>rate</strong> is rapid (200) but at the lower limit characteristic of "typical" <strong>atrial</strong> flutter.<br />
Conduction is partially blocked by decremental conduction at two serial levels within the AV<br />
node as shown in the Ladder. The calipers and plumb line are utilized to locate flutter waves<br />
obscured by the QRS complexes.
Copyright © 2006 <strong>Blaufuss</strong> <strong>Multimedia</strong>. All rights reserved. Page 13<br />
079 "Typical" Atrial Flutter, <strong>rate</strong> 360<br />
Variable Second Degree A-V Block, ventricular <strong>rate</strong> 128<br />
Right Axis Deviation<br />
Incomplete RBBB<br />
Left Ventricular Hypertrophy<br />
a) Atrial rhythm rapid (360) and regular throughout; "saw-teeth" in aVF<br />
b) Ventricular <strong>rate</strong> less that <strong>atrial</strong>, with varying conduction intervals<br />
c) RSR' in V1 and V2, QRS duration 100 msec.<br />
d) R in <strong>II</strong>I taller than R in <strong>II</strong>, axis > <strong>90</strong> o .<br />
e) R wave 2.3 mV in V6 (Liu-DeCristofaro Criterion, R>1.8 mV)<br />
Note: This ECG depicts <strong>atrial</strong> flutter near the upper range (400), in contrast to 078 which<br />
showed <strong>atrial</strong> <strong>rate</strong> at the lower range (200). The undulating baseline ion V1 resembles the<br />
coarse fibrillation seen in 074 but in this instance the <strong>atrial</strong> rhythm is precisely regular. To<br />
confirm precise regularity, use the calipers and take "big bites" (3-4 seconds) with the caliper<br />
points on the peaks of the <strong>atrial</strong> waves in V1, and then slide or swivel the calipers over the<br />
ECG (avoiding "contamination" by superimposed QRS and T waves) to see that the caliper<br />
points invariably fall on peaks throughout the V1 rhythm strip. The saw-tooth pattern in leads <strong>II</strong>,<br />
<strong>II</strong>I, and aVF indicates that the macro-reentry loop is in the right atrium as shown in the SVT<br />
Tutorial. Right QRS axis in the presence of LVH is a criterion for biventricular hypertrophy.<br />
079: "Big bites" with the calipers establish that the <strong>atrial</strong> rhythm is regular when the points<br />
consistently fall on the same part of the <strong>atrial</strong> complexes when they are not distorted by<br />
superimposition of QRS or T waves.
Copyright © 2006 <strong>Blaufuss</strong> <strong>Multimedia</strong>. All rights reserved. Page 14<br />
081 <strong>Sinus</strong> Bradycardia, <strong>atrial</strong> <strong>rate</strong> 40<br />
Junctional Escape <strong>Rhythm</strong>, <strong>rate</strong> 46<br />
Resulting A-V Dissociation (by "default")<br />
a) P and QRS at different <strong>rate</strong>s and rhythms, ventricular <strong>rate</strong> faster than <strong>atrial</strong><br />
b) P-P intervals constant (1500 msec or 40 bpm)<br />
c) R-R intervals without preceding P waves similar (1265 to 1305 msec)<br />
Note: This ECG resembles 056 in that both have sinus bradycardia combined with a junctional<br />
rhythm with resulting AV Dissociation with ventricular <strong>rate</strong> faster than <strong>atrial</strong>. Although the sinus<br />
node-originated QRS complexes (e.g., short R-R intervals preceded by p waves in beats 3, 6,<br />
and 9) are different in appearance, all of the complexes are supraventricular in origin (QRS<br />
Copyright © 2006 <strong>Blaufuss</strong> <strong>Multimedia</strong>. All rights reserved. Page 15<br />
132 Supraventricular rhythm, <strong>rate</strong> 85 (82-89)<br />
Left Axis Deviation (possibly due to Inferior Myocardial Infarction)<br />
Right Bundle Branch Block<br />
a) P waves not seen<br />
b) R minus S in aVL greater than in lead I, QRS positive in aVR<br />
b) QRS duration 120 msec, latest QRS summit in V1<br />
Note: This 86 year old woman was recovering from mitral valve replacement and the<br />
subsequent arrhythmias (133 and 134) caused considerable hemodynamic instability, so that it<br />
was imperative to establish their nature in order to deploy appropriate management.<br />
132: P waves are not clearly seen in this seemingly regular supraventricular rhythm, which led<br />
us to believe initially that it was an accele<strong>rate</strong>d junctional rhythm. However on closer<br />
inspection, the R-R intervals are irregular, whereas junctional rhythms are usually regular.<br />
(Use the calipers to confirm that there is considerable variation in the R-R intervals). The<br />
nature of this arrhythmia will become clearer after examining the next three ECGs (133, 134<br />
and 135) obtained shortly afterwards. Subsequent ECGs indicated that there are P waves<br />
hidden in the S-T segments conducting anterograde with long P-R intervals (first degree AV<br />
block).
Copyright © 2006 <strong>Blaufuss</strong> <strong>Multimedia</strong>. All rights reserved. Page 16<br />
133 Paroxysmal Atrial Tachycardia with RBBB, <strong>rate</strong> 140, alternating with<br />
Accele<strong>rate</strong>d Idioventricular <strong>Rhythm</strong> (AIVR) <strong>rate</strong> 92<br />
Resulting in AV Dissociation and...<br />
Fusion Beats<br />
a) Narrower (120 msec) QRS complexes with RBBB have <strong>rate</strong> of 140<br />
b) Wider complexes (160 msec) with LBBB configuration have <strong>rate</strong> of 92<br />
c) Ventricular <strong>rate</strong> exceeds <strong>atrial</strong> <strong>rate</strong> when <strong>atrial</strong> rhythm slows<br />
d) Fusion beats during transition<br />
Note: The presence of both supraventricular and ventricular complexes is confirmed by the<br />
presence of fusion beats (beats 2 and 12) intermediate in appearance between the two "parent<br />
beats." The ST-T waves associated with the <strong>atrial</strong> tachycardia exhibit variable degrees of<br />
distortion, suggesting the presence of dissociated P waves with different timing. Two isolated<br />
P waves are seen, one inverted P in Lead <strong>II</strong>I following the first QRS, and the other upright P in<br />
aVF preceding the 8th QRS on the recording.<br />
133: Two different rhythms alternate: A rapid rhythm with QRS complexes resembling those<br />
in 132 and a slower rhythm with wider QRS. Two fusion (F) beats, designated by colliding<br />
arrows in the ventricular column on the Ladder are seen at the transition points between the 2<br />
rhythms. These fusion beats confirm that the wider QRS with slower <strong>rate</strong> must be of<br />
ventricular origin, and is an accele<strong>rate</strong>d idioventricular rhythm (AIVR). Atrial activity is<br />
indicated on the Ladder with asterisks in the <strong>atrial</strong> column, indicating an ectopic <strong>atrial</strong> rhythm<br />
that accele<strong>rate</strong>s to tachycardia, with the P waves obscured within the ST-T portion of the<br />
narrower QRS complexes. The first P wave initiating the accelerating <strong>atrial</strong> rhythm is best<br />
seen in Lead <strong>II</strong>I because it occurs at the end of the T wave of the preceding ventricular beat.<br />
The P waves will be clearly seen on the next ECG (134) on the right <strong>atrial</strong> electrogram.
Copyright © 2006 <strong>Blaufuss</strong> <strong>Multimedia</strong>. All rights reserved. Page 17<br />
134 (Intracardiac Right Atrial Lead replaces V1)<br />
Paroxysmal Atrial Tachycardia with RBBB, ramping from 88-140, alternating with<br />
Accele<strong>rate</strong>d Idioventricular <strong>Rhythm</strong> (AIVR) <strong>rate</strong> 92<br />
Resulting in AV Dissociation and...<br />
Fusion Beats<br />
a) Intracardiac P waves are seen in V1<br />
b) AIVR present in beats 1-3 and 11-13 (upward arrows denote ventricular origin)<br />
c) Atrial Tachycardia in beats 4-10 and 14-19<br />
d) P waves briefly drive tachycardia 1:1 as <strong>atrial</strong> <strong>rate</strong> ramps up before<br />
Note: Atrial electrodes (placed by the surgeon before closing the chest after valve<br />
replacement) were accessed for recording electrograms in the V1 lead position on the ECG.<br />
These recordings clarified some aspects of the complex arrhythmias, and were also used for<br />
pacing (see 135) that stabilized her rhythm and facilitated uneventful recovery. Her sinus<br />
rhythm resumed after 48 hours of <strong>atrial</strong> pacing.<br />
134: The plumb line is used to differentiate the P waves from the QRS complexes on the<br />
intracardiac rhythm strip replacing V1 on the last beat on the far right. The <strong>atrial</strong> signals are<br />
magnified because the exploring lead is in contact with the right atrium, and are seen to occur<br />
during the S-T segment of the surface ECG. The irregular ectopic <strong>atrial</strong> activity is plotted on<br />
the Ladder with asterisks (*). It can be seen that there is anterograde conduction when the P<br />
waves emerge from the ventricular refractory period and accele<strong>rate</strong> to overtake the ventricular<br />
rhythm. When <strong>atrial</strong> activity slows, the accele<strong>rate</strong>d idioventricular rhythm (AIVR) takes over for<br />
three beats until the ectopic <strong>atrial</strong> focus recovers and ramps up the <strong>rate</strong> again. Although the P<br />
waves are negative in the inferior leads and follow the QRS complexes at the start of the<br />
rhythm strip (suggesting retrograde VA conduction) the <strong>atrial</strong> activity is independent of the<br />
AIVR. Note the P wave within the first QRS complex in the 3 beat segment of AIVR.<br />
The next ECG (135) establishes that anterograde AV conduction is intact in this patient.
Copyright © 2006 <strong>Blaufuss</strong> <strong>Multimedia</strong>. All rights reserved. Page 18<br />
135 Atrial Pacing, <strong>rate</strong> <strong>90</strong>, with 1:1 capture<br />
Right Bundle Branch Block<br />
Digoxin toxicity<br />
a) Pacing "spikes" initiate P waves which conduct to ventricle<br />
b) Broad QRS with late R wave summit in V1<br />
c) Prior Arrhythmias -- sinus node suppression and paroxysmal <strong>atrial</strong> tachycardia<br />
135: This ECG clarifies several confusing aspects seen on this patient's previous tracings. The<br />
QRS complexes are identical to those in 132 and the narrower complexes in 133 and 134,<br />
confirming that 132 had to represent a supraventricular rhythm. The bursts of rapid rhythm in<br />
133 resemble these complexes as well. Lastly, the integrity of atrioventricular conduction is<br />
affirmed by 1:1 capture at a normal P-R interval (160 msec). In summary, the principal<br />
problem following open heart surgery in this patient was the lack of competent sinus node<br />
function, which in turn led to competing takeovers by an unstable <strong>atrial</strong> rhythm and AIVR.<br />
Intact AV conduction prompted utilization of <strong>atrial</strong> pacing to stabilize the rhythm. It was later<br />
learned that the patient had elevated serum digoxin levels, which helped explain the<br />
suppression of the sinus node, accele<strong>rate</strong>d <strong>atrial</strong> rhythm, and AIVR.
Copyright © 2006 <strong>Blaufuss</strong> <strong>Multimedia</strong>. All rights reserved. Page 19<br />
142 <strong>Sinus</strong> Tachycardia, <strong>rate</strong> 112<br />
Parasystolic Ventricular Premature Complexes (VPCs)<br />
Fusion Beats<br />
Left Atrial Enlargement<br />
*LVH<br />
a) Regular, rapid supraventricular rhythm with normal P waves<br />
b) Variable coupling of VPCs to sinus beats with constant inter-ectopic intervals<br />
c) Fusion beats<br />
d) Broad P waves with negative deflections .04 sec and 0.1 mV in V1<br />
e) Prominent R in LV leads, delayed activation time in V6, inverted T waves<br />
Note: There are 4 premature FLBs (funny looking beats) that occur after the sinus P waves.<br />
The most premature complexes (beats 4 and 14) are wider and exhibit taller R waves. When<br />
these beats are compared in leads <strong>II</strong> and <strong>II</strong>I they look similar to each other but have T waves<br />
of different depths. Most Ventricular Premature Complexes (VPCs) occur at fixed "coupling<br />
intervals" after the native QRS as a result of a micro-reentry pathway that links them to the<br />
prior ventricular depolarization. In this ECG these complexes have differing relationships with<br />
the preceding R waves, but are coupled to each other with 1550 msec spacing. This fixed<br />
inter-ectopic interval suggests that they arise from an ectopic focus independent of the rest of<br />
the conduction system -- a parasystolic focus. The differing P-R relationships result in different<br />
degree of fusion, with more expression of the native QRS in the later fusion beats. LVH<br />
cannot be diagnosed by strict voltage criteria, but the left <strong>atrial</strong> enlargement, delayed<br />
ventricular activation time (VAT), and ST-T changes permit the diagnosis by the Romhilt-Estes<br />
point system.<br />
142: The VPCs occur at slightly different intervals after the preceding P wave causing different<br />
degrees of fusion. The interectopic (VPC to VPC) intervals are constant, and the long interval<br />
between the calipers is approximately twice 1550 msec (31<strong>90</strong> msec).
Copyright © 2006 <strong>Blaufuss</strong> <strong>Multimedia</strong>. All rights reserved. Page 20<br />
146 Ventricular Tachycardia, <strong>rate</strong> 135<br />
A-V Dissociation with Fusion (<strong>atrial</strong> <strong>rate</strong> 78)<br />
Note: Wide complex tachycardias are often difficult to diagnose with certainty, but if A-V<br />
dissociation and fusion beats are present, the diagnosis of ventricular tachycardia is assured,<br />
as in this example. The fusion beats can be found in the V1 rhythm strip by looking for<br />
narrower QRS complexes with shallower T waves: beats 4, 11, and 16. A-V dissociation can<br />
be found by looking for P waves that are not obscured by QRS complexes (marked with<br />
arrows below the rhythm strip). Hidden P waves can be found by setting the calipers for an<br />
observed P-P interval, then swiveling forward and backward to look for distortion of the QRS or<br />
T wave. Fusion beats will represent participation in the depolarization from ventricular and<br />
supraventricular foci. In the Ladder, beats of ventricular origin are designated by asterisks (*)<br />
and upward arrows, while fusion beats are shown by colliding arrows in the ventricular column.<br />
146: P waves are marked with thin arrows at the bottom of the figure, and obscured P waves<br />
can be plotted by setting the calipers for observed P-P intervals and dividing by 2.<br />
The spectrum of A-V Dissociation is illust<strong>rate</strong>d with Ventricular Tachycardia highlighted.
Copyright © 2006 <strong>Blaufuss</strong> <strong>Multimedia</strong>. All rights reserved. Page 21<br />
160 Atrioventricular Nodal Reentry Tachycardia (AVNRT), <strong>rate</strong> 160<br />
Left Axis Deviation<br />
Low Voltage in Limb Leads<br />
Left Ventricular Hypertrophy (Cornell Criterion: R in aVL plus S in V3 = 2.5 mV)<br />
160: Narrow complex tachycardia bespeaks supraventricular origin; the absence of obvious P<br />
waves renders unlikely either sinus or <strong>atrial</strong> tachycardia. If retrograde P waves can be seen<br />
after the QRS, AVNRT is the probable cause. The "pseudo R waves" in this patient with dilated<br />
cardiomyopathy are actually tall Ps. Reentry within the AV Node is diagrammed in the Ladder.<br />
161: The previously seen "pseudo R waves" in V1 have moved in front of the QRS complexes<br />
and are shown to be large P waves indicating right <strong>atrial</strong> enlargement.
Copyright © 2006 <strong>Blaufuss</strong> <strong>Multimedia</strong>. All rights reserved. Page 22<br />
163 <strong>Sinus</strong> <strong>Rhythm</strong>, <strong>rate</strong>s 56-60<br />
Accele<strong>rate</strong>d Idioventricular <strong>Rhythm</strong> (AIVR) <strong>rate</strong> 58<br />
Resulting in Atrioventricular Dissociation and...<br />
Fusion Beats<br />
Note: This ECG depicts a blend of two independent rhythms with more influence of the<br />
ventricular component on the far left and far right, and the conducted supraventricular beats in<br />
the middle. The beat with the narrowest QRS and smallest T in the rhythm strip is conducted<br />
from the sinus node, while those with widest QRS and tallest T waves are of ventricular origin.<br />
AIVR is usually a benign rhythm disorder seen after myocardial infarctions, following<br />
spontaneous or iatrogenic thrombolysis and reperfusion. Although voltage criteria for left<br />
ventricular hypertrophy are met, the presence of fusion invalidates the measurements.<br />
163: P waves occur prior to every QRS, but the P-R interval is shortest when the QRS is wide<br />
and longer when the QRS is narrow and the T wave is lowest; they undergo transition from<br />
wide to narrow and back. Atrial and ventricular <strong>rate</strong>s average 58 bpm; the <strong>atrial</strong> <strong>rate</strong><br />
accele<strong>rate</strong>s toward the center and then slows toward the right, while the ventricular <strong>rate</strong> is<br />
constant at 58. The ventricular <strong>rate</strong> exceeds <strong>atrial</strong> in this form of AV dissociation.
Copyright © 2006 <strong>Blaufuss</strong> <strong>Multimedia</strong>. All rights reserved. Page 23<br />
166 Multifocal Atrial Tachycardia (MFAT) <strong>rate</strong>s 140 -160<br />
Rate-related Left Bundle Branch Block (LBBB)<br />
Old Inferior Myocardial Infarction<br />
a) P waves are rapid, irregular in timing, vary in configuration, and precede every QRS<br />
b) When <strong>rate</strong> accele<strong>rate</strong>s, QRS becomes wide with secondary T wave changes<br />
c) Before bundle branch block appears, deep, broad Q waves are seen in inferior leads<br />
Note: This ECG was thought by many to represent the onset of "ventricular tachycardia," but<br />
the gross irregularity and presence of P waves (sharp deflections superimposed on the T<br />
waves) disproves this interpretation. The LBBB is not strictly <strong>rate</strong> related, in that some of the<br />
normally conducted beats have shorter R-R intervals than some of the LBBB beats, but the<br />
trend on this and other ECGs from this individual was to develop LBBB when the <strong>atrial</strong> <strong>rate</strong><br />
accele<strong>rate</strong>d. It is interesting to note the masking of the Q waves in aVF and the emulation of a<br />
lateral infarction in aVL when the LBBB commences.<br />
166: Prior to the onset of the wide complex irregular tachycardia, P waves of differing<br />
configuration can be seen (arrows) and are seen to continue throughout the strip. Note the<br />
different shapes of the P waves in the limb leads as the <strong>rate</strong> accele<strong>rate</strong>s, and the Q waves in<br />
<strong>II</strong>, <strong>II</strong>I, and aVF indicative of an old inferior wall infarction. The wide QRS complexes have an<br />
RSR' pattern in V6, indicating delayed conduction in the territory served by the left bundle.<br />
Although this wide complex tachycardia resembles ventricular tachycardia, the irregularity and<br />
1:1 relation with the P waves indicates supraventricular origin.
Copyright © 2006 <strong>Blaufuss</strong> <strong>Multimedia</strong>. All rights reserved. Page 24<br />
167 Ventricular Tachycardia, <strong>rate</strong> 234<br />
V-A Conduction (2:1)<br />
Note: Wide complex tachycardias can be of either supraventricular or ventricular origin, and it<br />
is often difficult to differentiate them. The superior axis and the monophasic appearance in the<br />
right precordial leads favor ventricular origin of the tachycardia. The important point is that the<br />
<strong>rate</strong> is extremely rapid and poorly tole<strong>rate</strong>d, and regardless of cause should be treated with<br />
prompt countershock to minimize myocardial ischemia.<br />
167: Upward arrows below the rhythm strip point to P waves that seem to occur in a 2:1 ratio<br />
after alternate QRS complexes. Some uncertainty about the relationship between atria and<br />
ventricles occurs when the P waves are not as clearly visible at the onset of the rhythm strip,<br />
as well as in the inability to discern P waves in the limb leads to confirm that they are<br />
conducted from the ventricle to the atria. Ventricular tachycardia may be dissociated<br />
(completely independent of <strong>atrial</strong> activity) as seen in 146, conduct retrograde 1:1 through the<br />
AV node (see 658 and 659), or conduct intermittently as seen here and in 702.<br />
The rapid ventricular <strong>rate</strong> exceeds the <strong>atrial</strong> <strong>rate</strong>, qualifying as the highlighted form of AV<br />
Dissociation: Ventricular tachycardia.
Copyright © 2006 <strong>Blaufuss</strong> <strong>Multimedia</strong>. All rights reserved. Page 25<br />
169 Atrial Fibrillation<br />
Left-sided Accessory Pathway Conduction, <strong>rate</strong> 210<br />
a) Rapid, irregular rhythm<br />
b) Wide (160 msec) QRS with "Right Bundle Branch-like" configuration<br />
Note: The individual QRS complexes resemble those of ventricular tachycardia because they<br />
are gene<strong>rate</strong>d in the same manner as ventricular ectopic beats, spreading across the<br />
myocardium fiber-to-fiber from the point of insertion of the accessory pathway without benefit<br />
of the His-Purkinje system utilized in normal ventricular depolarization. The rhythm is grossly<br />
irregular--too irregular to be ventricular tachycardia and thus a result of <strong>atrial</strong> fibrillation. Some<br />
R-R intervals reveal the ability to conduct beats at a <strong>rate</strong> of over 300. The frontal plane axis is<br />
markedly rightward and the R waves are widest in V1.<br />
169: The QRS configuration is typical of beats of ventricular origin, but the gross irregularity of<br />
this rapid rhythm is caused by <strong>atrial</strong> fibrillation and is incompatible with ventricular tachycardia.<br />
The right bundle branch block configuration indicates that the bypass tract is left-sided, initially<br />
activating the left ventricle and slowly spreading the wave of depolarization over the right<br />
ventricle. Compare this ECG with the next tracings from the same patient (170 and 171).
Copyright © 2006 <strong>Blaufuss</strong> <strong>Multimedia</strong>. All rights reserved. Page 26<br />
170 Atrial Fibrillation<br />
Accessory Pathway conduction, <strong>rate</strong> 220<br />
Fusion beats<br />
a) Rapid, irregular rhythm<br />
b) Wide (160 msec) QRS with "ventriculoid" configuration<br />
c) Occasional narrow QRS complexes of variable appearance<br />
Note: This ECG is from the same patient as 169 and provides more definitive proof of the<br />
mechanism of the arrhythmia. Once again the <strong>rate</strong> is rapid, the rhythm irregular, and the<br />
majority of the beats resemble those of ventricular origin. However on this recording one<br />
normal QRS complex (10 th beat) and 4 species of fusion beats are seen. The 5 th beat is<br />
narrow and reveals a near 50:50 blend of the "parent beats" (His-Purkinje and Bypass Tract),<br />
whereas the 9 th beat, and the two beats seen at the end of the V1-3 recordings reveal more<br />
evidence of pre-excitation from the bypass tract contribution (tall R waves with effacement of S<br />
waves). This is a poorly tole<strong>rate</strong>d and potentially fatal arrhythmia and should be terminated by<br />
countershock without delay.<br />
170: This recording demonst<strong>rate</strong>s three variations of AV conduction.<br />
1. A-V Nodal and His-Purkinje Conduction (N)<br />
2. Fusion Beats with Pre-Excitation (F)<br />
3. Bypass Tract Conduction (majority)<br />
One normally conducted beat (N) utilized the AV node and His-Purkinje system. Fusion beats<br />
(labeled F) are hybrid beats depolarized by both the bypass tract and the His-Purkinje to<br />
variable degrees. The rest are conducted down the left postero-septal bypass tract and<br />
resemble beats of ventricular origin (as are all of the beats in 169).
Copyright © 2006 <strong>Blaufuss</strong> <strong>Multimedia</strong>. All rights reserved. Page 27<br />
171 <strong>Sinus</strong> tachycardia, <strong>rate</strong> 108<br />
Wolff-Parkinson-White Syndrome<br />
a) P waves upright in I and aVF, <strong>rate</strong> >100<br />
b) Slurred upstrokes of QRS complexes<br />
c) P-R intervals 100 msec*<br />
Note: This recording was made a few minutes after countershock had terminated the rhythm<br />
seen in 168 and 169 and demonst<strong>rate</strong>s the cardinal features of combined accessory pathway<br />
pre-excitation and His-Purkinje conduction (fusion) in WPW. In ECGs 168 and 169 the widest<br />
and tallest R waves are seen in V1. In 171 the initial portion of the QRS is caused by<br />
accessory pathway conduction ("delta waves") best seen in V1.<br />
* The PR intervals should be measured in leads in which the delta waves are prominent. If the<br />
pre-excitation is isoelectric, as in lead I, the PR interval measured in that lead may appear to<br />
be normal.<br />
171: The standard limb leads are magnified to demonst<strong>rate</strong> the P-R interval as seen in these 3<br />
leads. The onset of the P waves are aligned with a bold grid line, and the plumb line is placed<br />
on the onset of the QRS in Lead I, yielding a normal PR interval of 140 msec. However in<br />
Leads <strong>II</strong> and <strong>II</strong>I an up-sloping delta wave is seen 100 msec after the onset of the P wave in <strong>II</strong>I,<br />
confirming the timing of onset of activation due to accele<strong>rate</strong>d AV conduction via the bypass<br />
tract.
Copyright © 2006 <strong>Blaufuss</strong> <strong>Multimedia</strong>. All rights reserved. Page 28<br />
177 <strong>Sinus</strong> <strong>Rhythm</strong> with First Degree AV Block (P-R 810 msec)...<br />
or Junctional <strong>Rhythm</strong> with Retrograde P waves, <strong>rate</strong> 53<br />
Nonspecific S-T and T waves, consider Ischemia<br />
a) There is a seemingly constant P-R (and R-P) relationship throughout; P-R= 810<br />
b) T waves are flat in most leads and inverted in I, aVL, and V4-6<br />
Note: Without additional data, this ECG could either be interpreted as first degree A-V block<br />
with a very long P-R interval or a junctional escape rhythm with retrograde P waves. The<br />
exceptionally long P-R interval (over 800 msec) would seemingly render the first possibility<br />
very unlikely, while the latter diagnosis is supported by a <strong>rate</strong> typical for junctional escape<br />
rhythm and the suggestion that the P waves in <strong>II</strong>I are inverted (and therefore conducted<br />
retrograde from the junctional focus).<br />
177: The 2 possible mechanisms to explain this rhythm are placed on the Ladder, and the<br />
calipers measure the P-R interval (810 msec) if anterograde conduction is the mechanism of<br />
this arrhythmia. The following ECG obtained on the same patient will confirm the mechanism<br />
underlying this arrhythmia. (Hint: Measure the R-R and P-P intervals with the calipers; a<br />
junctional rhythm should be regular, while sinus rhythm will usually show concurrent variation<br />
in P-P and R-R intervals, while maintaining constant P-R intervals).
Copyright © 2006 <strong>Blaufuss</strong> <strong>Multimedia</strong>. All rights reserved. Page 29<br />
178 <strong>Sinus</strong> <strong>Rhythm</strong>, <strong>rate</strong> 53<br />
<strong>Mobitz</strong> I (Wenckebach) A-V Block<br />
Nonspecific S-T and T waves, consider Ischemia<br />
a) Upright P waves are seen in I, <strong>II</strong>, and aVF (at same <strong>rate</strong> as ECG 177)<br />
b) Decremental A-V conduction with non-conducted beat interval
Copyright © 2006 <strong>Blaufuss</strong> <strong>Multimedia</strong>. All rights reserved. Page 30<br />
255 <strong>Sinus</strong> <strong>Rhythm</strong>, <strong>rate</strong> 85<br />
Multiple Atrial Premature Complexes<br />
Ashman-type Aberrancy<br />
Interventricular Conduction Defect<br />
a) Normal P waves with regular rhythm in beats 2-4<br />
b) Frequent premature P waves partially obscured in T waves<br />
c) Right bundle branch aberrancy on beats 7, 11, and 15<br />
Note: The first premature P wave is conducted to the ventricles with a normal QRS<br />
configuration; thereafter the premature beats have an aberrant (RBBB) appearance that<br />
resembles premature ventricular beats. Typically (but not invariably) <strong>atrial</strong> premature<br />
complexes are followed by pauses that are not "compensatory" as are those seen following<br />
ventricular ectopic beats. These pauses result from a delayed appearance of the next sinus P<br />
wave. The premature <strong>atrial</strong> depolarization traverses the sino-<strong>atrial</strong> junction retrograde to reset<br />
the sinus node, and the ensuing P wave is further delayed by the time required for the next<br />
sinus impulse to traverse the sino-<strong>atrial</strong> junction anterograde to depolarize the atrium. The<br />
sinus P-P (and R-R) intervals are 710 msec, while the pauses following the premature beats<br />
are 860 msec, a difference of 150 msec caused by the combined transit times entering and<br />
leaving the sinus node. The ensuing premature P waves (beats 7, 11, and 15) thus follow in<br />
the aftermath of longer preceding P-P (and R-R) intervals, and are therefore relatively more<br />
premature and aberrantly conducted. This phenomenon (long-short-aberrancy) is often seen<br />
in <strong>atrial</strong> fibrillation (see 074), and the aberrant beats are called "Ashman beats."<br />
255: The premature <strong>atrial</strong> P waves distort the T waves of the preceding sinus beats, and are<br />
designated by asterisks (*) on the Ladder. Aberrant (RBBB) conduction may result from<br />
absolute or relative prematurity in the timing of the premature <strong>atrial</strong> complexes. In this ECG,<br />
both mechanisms can be invoked.
Copyright © 2006 <strong>Blaufuss</strong> <strong>Multimedia</strong>. All rights reserved. Page 31<br />
324 <strong>Sinus</strong> <strong>Rhythm</strong> <strong>rate</strong> 88-96<br />
Atrial Premature Complex<br />
Ventricular Parasystole<br />
Left Ventricular Hypertrophy<br />
a) Upright P waves in I and aVF<br />
b) Early P wave (9 th beat) followed by pause (increase P'-P interval)<br />
c) Frequent wide complex premature beats with equal inter-ectopic intervals<br />
d) R in aVL 15 mm, secondary ST-T changes<br />
Note: At first glance this ECG resembles "frequent <strong>atrial</strong> premature complexes with RBBB<br />
aberrancy" because many of the aberrant beats are preceded by P waves and the initial half of<br />
the QRS complexes resembles the native beats. However, the P waves preceding the<br />
aberrant beats are not premature, but the P-R is shortened. The one actual premature <strong>atrial</strong><br />
complex (vertical arrow) is not followed by an aberrant QRS. The ventricular origin of the<br />
aberrant beats becomes clear when the P-R relationship is seen to vary (one of the complexes<br />
actually precedes the P wave), and each premature complex is followed by a compensatory<br />
pause. The inter-ectopic intervals are either constant (1150 msec) or a multiple of that<br />
constant (1150 X 3 = 3450), confirming that they are from an independent parasystolic focus<br />
with variable exit block. An additional confounding feature of this tracing is that the pause<br />
following the APC coincidentally emulates a "compensatory pause." Ventricular Parasystole is<br />
also seen in 142.<br />
324: The intervals between the sinus beats and the ectopic beats (coupling intervals) vary<br />
while the interectopic intervals are seen to be constant (1150 msec) or a multiple of that<br />
constant (1150 X 3 = 3450). The ectopic beats are therefore emanating from a pacemaker<br />
independent from and unaffected by the underlying sinus rhythm. The vertical arrow denotes<br />
the <strong>atrial</strong> premature complex which produces a normal QRS.
Copyright © 2006 <strong>Blaufuss</strong> <strong>Multimedia</strong>. All rights reserved. Page 32<br />
424 Wide Complex Tachycardia (AVNRT), <strong>rate</strong> 178<br />
Left Axis Deviation<br />
Left Ventricular Hypertrophy<br />
Interventricular Conduction Delay (IVCD)<br />
Note: This rhythm resembles ventricular tachycardia, and the only solid proof that it is actually<br />
of supraventricular origin can be seen in the next ECG (425) obtained earlier the same day<br />
during sinus rhythm in which the QRS complexes are very similar in axis, duration, and<br />
configuration. The absence of visible P waves suggests that it is atrioventricular nodal<br />
reentrant tachycardia (AVNRT), in which <strong>atrial</strong> depolarization occurs during the QRS complex,<br />
especially when the QRS is wide. The ladder indicates that anterograde conduction is down<br />
the slow pathway and retrograde reentry is via the fast pathway within the A-V node.<br />
424: This wide complex tachycardia (QRS 140 msec) would be hard to distinguish from<br />
ventricular tachycardia if it were not for the next ECG (425) obtained from the same patient in<br />
sinus rhythm exhibiting similar QRS configurations. The initial portion of the QRS complexes<br />
in Leads <strong>II</strong> and V3-6 has a sharp rise, unlike beats of ventricular origin.
Copyright © 2006 <strong>Blaufuss</strong> <strong>Multimedia</strong>. All rights reserved. Page 33<br />
425 <strong>Sinus</strong> <strong>Rhythm</strong>, <strong>rate</strong> 99<br />
Left Axis Deviation<br />
Interventricular Conduction Delay; Probable LVH<br />
Left Atrial Enlargement<br />
Note: This ECG confirms the supraventricular origin of the tachycardia seen in 424 because of<br />
the close resemblance of the QRS complexes in the two tracings. The QRS complexes are<br />
wide (140 msec), but not typical of LBBB, and probably represent left ventricular hypertrophy<br />
with interventricular conduction delay (IVCD). The P waves are broad (>120 msec) suggesting<br />
left <strong>atrial</strong> enlargement providing further evidence along with left axis deviation, tall R waves<br />
and inverted T waves favoring LVH.<br />
425: The QRS complexes in sinus rhythm resemble those in 424 and are compatible with left<br />
ventricular hypertrophy with interventricular conduction delay. Broad P waves in Lead <strong>II</strong> with<br />
negative terminal deflections in V1 suggest left <strong>atrial</strong> enlargement complementing the voltage<br />
and secondary T wave criteria for left ventricular hypertrophy.
Copyright © 2006 <strong>Blaufuss</strong> <strong>Multimedia</strong>. All rights reserved. Page 34<br />
658 Ventricular Tachycardia vs. Junctional Tachycardia, <strong>rate</strong> 138<br />
Ventriculo-<strong>atrial</strong> Conduction 1:1<br />
Note: The cause of this wide complex tachycardia with a RBBB configuration was confirmed<br />
by recording <strong>atrial</strong> potentials from an esophageal lead (see 660) that confirmed 1:1 V-A<br />
conduction and that the notches in the initial portion of the T waves were P waves.<br />
658: This wide complex tachycardia was well tole<strong>rate</strong>d by the patient, providing an opportunity<br />
to establish its origin. The Ladder indicates 1:1 VA conduction confirmed by esophageal lead<br />
electrogram in 659. One-to-one V-A conduction could have resulted from either a junctional or<br />
ventricular tachycardia.
Copyright © 2006 <strong>Blaufuss</strong> <strong>Multimedia</strong>. All rights reserved. Page 35<br />
659 Ventricular Tachycardia, <strong>rate</strong> 138<br />
Esophageal Lead Records Ventriculo-Atrial Conduction 1:1<br />
Esophageal Lead after Adenosine Causes VA Conduction Block<br />
659: The sharp biphasic P waves are seen at the end of the QRS in the Esophageal Lead<br />
recording when plumb lines bracket the QRS on the surface leads. When adenosine was<br />
administered, VA conduction was blocked while the ventricular <strong>rate</strong> remained rapid, indicating<br />
that the atrium was not responsible for or in a reentry circuit responsible for the tachycardia.<br />
The diagnosis of ventricular tachycardia was later re-confirmed during an electrophysiologic<br />
investigation during which a left ventricular focus was localized and successfully ablated.
Copyright © 2006 <strong>Blaufuss</strong> <strong>Multimedia</strong>. All rights reserved. Page 36<br />
701 <strong>Sinus</strong> <strong>Rhythm</strong> <strong>rate</strong> 87<br />
WPW<br />
a) Upright P waves in I and aVF<br />
b) Prominent "delta waves" in V1-3<br />
Note: This patient's ECGs were incorrectly read by many observers who thought that they<br />
represented either "infero-posterior infarction" or "right ventricular hypertrophy" because of the<br />
prominent Q waves in the inferior leads and the prominent R waves in V1-3. An astute<br />
cardiology fellow administered adenosine (see 700) and established the correct diagnosis of<br />
WPW. A confounding finding on this ECG is the seemingly normal P-R interval; it is actually<br />
at the lower limit of normal at 120 msec.<br />
701: WPW is indicated by the slurred upstroke of the QRS complexes seen well in V1-3. The<br />
P-R interval was measured by placing the onset of the P wave on a bold grid line and the<br />
plumb line on the onset of the QRS. The interval is 120 msec, the lower limit of normal AV<br />
conduction. Q waves are seen in the inferior leads, caused by pre-excitation through the<br />
bypass tract.
Copyright © 2006 <strong>Blaufuss</strong> <strong>Multimedia</strong>. All rights reserved. Page 37<br />
700 Adenosine Administration causes Transient...<br />
Sino-Atrial Block<br />
Atrioventricular Block<br />
"Pure" Bypass Tract Conduction Revealed<br />
Note: This 15 second continuous rhythm strip demonst<strong>rate</strong>s slowing of the <strong>atrial</strong> <strong>rate</strong> with an<br />
irregular rhythm resulting from 3:2 and 4:3 sino-<strong>atrial</strong> Wenckebach ("group beating" with<br />
pauses), as the QRS complexes progressively widen and resemble ventricular ectopic beats,<br />
but preceded by P waves. The P-R interval remains constant throughout. Toward the end of<br />
the strip the <strong>atrial</strong> <strong>rate</strong> increases, the rhythm becomes regular, and the QRS complexes<br />
undergo a transition back to their original configuration.<br />
700: The presence of WPW was uncovered by the administration of 12 mg Adenosine which<br />
progressively slowed the atrium, possibly by blocking sino-<strong>atrial</strong> conduction, and completely<br />
blocking atrioventricular conduction to reveal depolarization via the accessory bypass tract.<br />
The P-R interval remains constant, indicating that the initial portion of the QRS complex was<br />
activated by the bypass tract before Adenosine was administered and after its effect was<br />
dissipated.
Copyright © 2006 <strong>Blaufuss</strong> <strong>Multimedia</strong>. All rights reserved. Page 38<br />
702 Long Q-T Interval<br />
<strong>Sinus</strong> <strong>Rhythm</strong> with Frequent Ventricular Premature Complexes leading to...<br />
Fusion Beats and R-on-T leading to...<br />
Non Sustained Ventricular Tachycardia (Torsades de Pointes) Rate 165 and...<br />
"Ventriculo-Atrial Wenckebach"<br />
Note: A catheter electrode was placed in the right atrium to record an electrogram to aid in<br />
diagnosis and treatment of a young woman that had frequent syncopal episodes after taking<br />
her mother's thiazide diuretic pills for pre-menstrual bloating. The long Q-T interval was<br />
augmented by the medication, and frequent premature beats led to fusion beats (F) and R-on-<br />
T triggers that produced ventricular tachycardia. The episode illust<strong>rate</strong>d was initiated by R-on-<br />
T (arrow), and lasted about 10 seconds and spontaneously reverted to sinus tachycardia. The<br />
Q-T prolongation is best seen on the first beat after termination of tachycardia. Torsades de<br />
Pointes ("twisting of the points") is a form of ventricular tachycardia characterized by<br />
spontaneous spiraling of the QRS vector in a given lead from upright to inverted and back as<br />
seen best in these rhythm strips in V1. Torsades de Pointes (plural s in both words is silent)<br />
can be fatal, and is notoriously unresponsive to (and often caused by) antiarrhythmic drugs. In<br />
this patient, the rhythm was stabilized by administration of atropine which produced sinus<br />
tachycardia, preempting the ventricular ectopic beats and shortening the Q-T interval while the<br />
serum potassium level was restored to 4.5 mEq/L from an initial value of 2.8.<br />
702: The intracardiac Right Atrial electrogram recorded the P waves as discrete spikes that<br />
can be distinguished from the wider QRS complexes. Fusion beats (F) occur when ventricular<br />
ectopic beats occur after sinus Ps. When a ventricular ectopic complex occurs within the T<br />
wave of the second fusion beat (arrow next to F), Torsades is initiated. The atrium accele<strong>rate</strong>s<br />
and exhibits periodic pauses resulting from decremental retrograde conduction from ventricle<br />
to atrium with periodic blocked beats; V-A Wenckebach. <strong>Sinus</strong> rhythm resumed after the<br />
tachycardia spontaneously terminated. The prolonged T waves are especially prominent in the<br />
first beat of sinus rhythm because of the long R-R interval.
Copyright © 2006 <strong>Blaufuss</strong> <strong>Multimedia</strong>. All rights reserved. Page 39<br />
703 Ventricular Tachycardia, <strong>rate</strong> 126<br />
Atrial Rate 72; Atrioventricular Dissociation,<br />
Fusion Beats<br />
Note: The Lead <strong>II</strong> rhythm strip was not recorded concurrently with the 12 lead ECG<br />
703: Some P waves are evident; hidden P waves are found by setting the calipers. A<br />
conducted (sinus) beat (S) is the narrowest QRS, preceded by P. Fusion (F) beats are<br />
identified here by their flat T waves and preceded by P. All unmarked beats are ventricular.<br />
See if you can identify sinus (conducted), fusion, and ventricular beats in V1-V3 in the 12 Lead<br />
ECG. Note: It was not recorded concurrently with the Lead <strong>II</strong> rhythm strip.