Handbook of Frequency Stability Analysis
Handbook of Frequency Stability Analysis
Handbook of Frequency Stability Analysis
- No tags were found...

You also want an ePaper? Increase the reach of your titles
YUMPU automatically turns print PDFs into web optimized ePapers that Google loves.
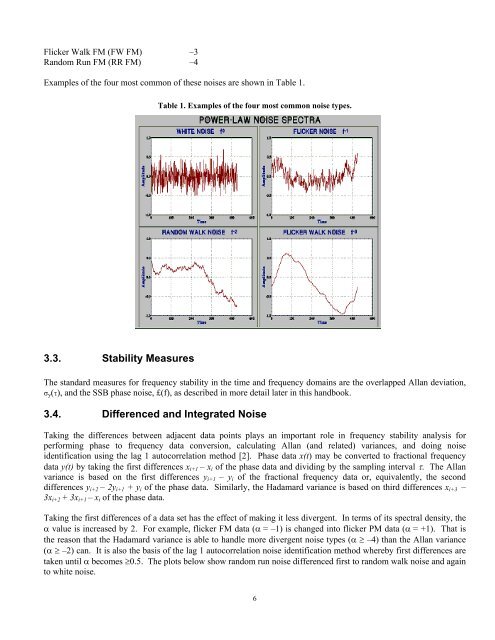
Flicker Walk FM (FW FM) –3Random Run FM (RR FM) –4Examples <strong>of</strong> the four most common <strong>of</strong> these noises are shown in Table 1.Table 1. Examples <strong>of</strong> the four most common noise types.3.3. <strong>Stability</strong> MeasuresThe standard measures for frequency stability in the time and frequency domains are the overlapped Allan deviation,σ y (τ), and the SSB phase noise, £(f), as described in more detail later in this handbook.3.4. Differenced and Integrated NoiseTaking the differences between adjacent data points plays an important role in frequency stability analysis forperforming phase to frequency data conversion, calculating Allan (and related) variances, and doing noiseidentification using the lag 1 autocorrelation method [2]. Phase data x(t) may be converted to fractional frequencydata y(t) by taking the first differences x i+1 – x i <strong>of</strong> the phase data and dividing by the sampling interval τ. The Allanvariance is based on the first differences y i+1 – y i <strong>of</strong> the fractional frequency data or, equivalently, the seconddifferences y i+2 – 2y i+1 + y i <strong>of</strong> the phase data. Similarly, the Hadamard variance is based on third differences x i+3 –3x i+2 + 3x i+1 – x i <strong>of</strong> the phase data.Taking the first differences <strong>of</strong> a data set has the effect <strong>of</strong> making it less divergent. In terms <strong>of</strong> its spectral density, theα value is increased by 2. For example, flicker FM data (α = –1) is changed into flicker PM data (α = +1). That isthe reason that the Hadamard variance is able to handle more divergent noise types (α ≥ –4) than the Allan variance(α ≥ –2) can. It is also the basis <strong>of</strong> the lag 1 autocorrelation noise identification method whereby first differences aretaken until α becomes ≥0.5. The plots below show random run noise differenced first to random walk noise and againto white noise.6