Handbook of Frequency Stability Analysis
Handbook of Frequency Stability Analysis
Handbook of Frequency Stability Analysis
- No tags were found...
You also want an ePaper? Increase the reach of your titles
YUMPU automatically turns print PDFs into web optimized ePapers that Google loves.
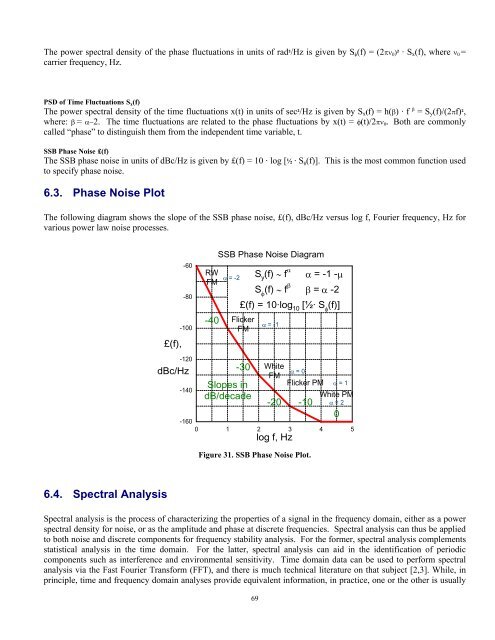
The power spectral density <strong>of</strong> the phase fluctuations in units <strong>of</strong> rad²/Hz is given by S φ (f) = (2πν 0 )² · S x (f), where ν 0 =carrier frequency, Hz.PSD <strong>of</strong> Time Fluctuations S x (f)The power spectral density <strong>of</strong> the time fluctuations x(t) in units <strong>of</strong> sec²/Hz is given by S x (f) = h(β) · f β = S y (f)/(2πf)²,where: β = α−2. The time fluctuations are related to the phase fluctuations by x(t) = φ(t)/2πν 0 . Both are commonlycalled “phase” to distinguish them from the independent time variable, t.SSB Phase Noise £(f)The SSB phase noise in units <strong>of</strong> dBc/Hz is given by £(f) = 10 · log [½ · S φ (f)]. This is the most common function usedto specify phase noise.6.3. Phase Noise PlotThe following diagram shows the slope <strong>of</strong> the SSB phase noise, £(f), dBc/Hz versus log f, Fourier frequency, Hz forvarious power law noise processes.£(f),-60-80-100RWFM-40SSB Phase Noise Diagramα = -2FlickerFMS y(f) ∼ f αα = -1α = -1 -μS φ(f) ∼ f β β = α -2£(f) = 10·log 10[½· S φ(f)]-120dBc/Hz-140-160-30Slopes indB/decadeWhiteFM-20α = 0Flicker PM α = 1White PMα = 20 1 2 3 4 5log f, Hz-10Figure 31. SSB Phase Noise Plot.06.4. Spectral <strong>Analysis</strong>Spectral analysis is the process <strong>of</strong> characterizing the properties <strong>of</strong> a signal in the frequency domain, either as a powerspectral density for noise, or as the amplitude and phase at discrete frequencies. Spectral analysis can thus be appliedto both noise and discrete components for frequency stability analysis. For the former, spectral analysis complementsstatistical analysis in the time domain. For the latter, spectral analysis can aid in the identification <strong>of</strong> periodiccomponents such as interference and environmental sensitivity. Time domain data can be used to perform spectralanalysis via the Fast Fourier Transform (FFT), and there is much technical literature on that subject [2,3]. While, inprinciple, time and frequency domain analyses provide equivalent information, in practice, one or the other is usually69


