
Create successful ePaper yourself
Turn your PDF publications into a flip-book with our unique Google optimized e-Paper software.
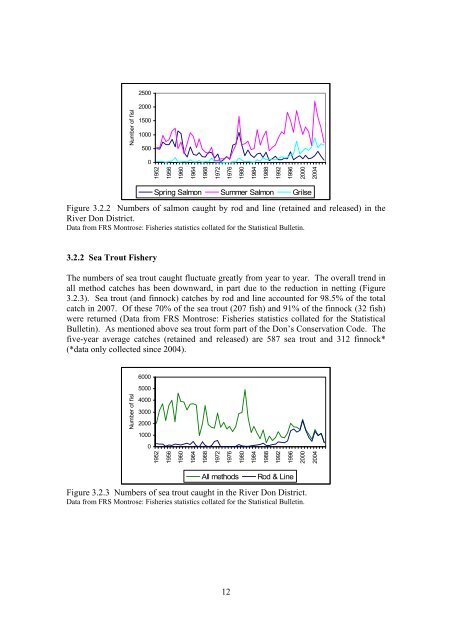
2500200015001000500019521956196019641968197219761980198419881992199620002004Number of fishSpring Salmon Summer Salmon GrilseFigure 3.2.2 Numbers of salmon caught by rod and line (retained and released) in theRiver <strong>Don</strong> District.Data from FRS Montrose: Fisheries statistics collated for the Statistical Bulletin.3.2.2 Sea Trout <strong>Fishery</strong>The numbers of sea trout caught fluctuate greatly from year to year. The overall trend inall method catches has been downward, in part due to the reduction in netting (Figure3.2.3). Sea trout (and finnock) catches by rod and line accounted for 98.5% of the totalcatch in 2007. Of these 70% of the sea trout (207 fish) and 91% of the finnock (32 fish)were returned (Data from FRS Montrose: Fisheries statistics collated for the StatisticalBulletin). As mentioned above sea trout form part of the <strong>Don</strong>’s Conservation Code. Thefive-year average catches (retained and released) are 587 sea trout and 312 finnock*(*data only collected since 2004).Number of fish600050004000300020001000019521956196019641968197219761980198419881992199620002004All methodsRod & LineFigure 3.2.3 Numbers of sea trout caught in the River <strong>Don</strong> District.Data from FRS Montrose: Fisheries statistics collated for the Statistical Bulletin.12