- Page 3:
Applied Fracture Mechanicshttp://dx
- Page 10 and 11:
PrefaceKnowledge accumulated in the
- Page 14:
Section 1Computational Methods of F
- Page 17 and 18:
4 Applied Fracture Mechanics2 Appli
- Page 19 and 20:
R 0r 06 Applied Fracture Mechanics4
- Page 21 and 22:
8 Applied Fracture Mechanics6 Appli
- Page 23 and 24:
10 Applied Fracture Mechanics8 Appl
- Page 25 and 26:
12 Applied Fracture Mechanics10 App
- Page 27 and 28:
14 Applied Fracture Mechanics12 App
- Page 29 and 30:
16 Applied Fracture Mechanics14 App
- Page 31 and 32:
18 Applied Fracture Mechanics16 App
- Page 33 and 34:
20Applied Fracture Mechanicsto be s
- Page 35 and 36:
22Applied Fracture MechanicsFigure
- Page 37 and 38:
24Applied Fracture MechanicsTherefo
- Page 39 and 40:
26Applied Fracture MechanicsAs the
- Page 41 and 42:
28Applied Fracture Mechanicsand the
- Page 43 and 44:
30Applied Fracture MechanicsAggrega
- Page 45 and 46:
32Applied Fracture Mechanicsphenome
- Page 47 and 48:
34Applied Fracture Mechanicsup the
- Page 49 and 50:
36Applied Fracture Mechanicsmeasure
- Page 51 and 52:
38Applied Fracture Mechanicsassumpt
- Page 53 and 54:
40Applied Fracture Mechanicsanalysi
- Page 55 and 56:
42Applied Fracture Mechanicswork, o
- Page 57 and 58:
44Applied Fracture MechanicsThe mag
- Page 59 and 60:
46Applied Fracture Mechanicscleavag
- Page 61 and 62:
48Applied Fracture Mechanicsknol(1
- Page 63 and 64:
50Applied Fracture Mechanicsand Fig
- Page 65 and 66:
52Applied Fracture Mechanicsenergy
- Page 67 and 68:
54Applied Fracture MechanicsFigure
- Page 69 and 70:
56Applied Fracture MechanicsThe cur
- Page 71 and 72:
58Applied Fracture Mechanicswhich i
- Page 73 and 74:
60Applied Fracture MechanicsFigure
- Page 75 and 76:
62Applied Fracture Mechanics5. Conc
- Page 77 and 78:
64Applied Fracture Mechanics[18] Mc
- Page 79 and 80:
66Applied Fracture Mechanicsde São
- Page 81 and 82:
68Applied Fracture Mechanicsanalyti
- Page 83 and 84:
70Applied Fracture Mechanicslower l
- Page 85 and 86:
72Applied Fracture Mechanics2 2lLlU
- Page 87 and 88:
74Applied Fracture Mechanicswhich c
- Page 89 and 90:
76Applied Fracture MechanicsWhere U
- Page 91 and 92:
78Applied Fracture MechanicsOr, by
- Page 93 and 94:
80Applied Fracture MechanicsThe ela
- Page 95 and 96:
82Applied Fracture MechanicsanddL
- Page 97 and 98:
84Applied Fracture MechanicsKIRodL
- Page 99 and 100:
86Applied Fracture MechanicsReturni
- Page 101 and 102:
88Applied Fracture Mechanics6.3.1.
- Page 103 and 104:
90Applied Fracture MechanicsThis re
- Page 105 and 106:
92Applied Fracture Mechanics(0L ) t
- Page 107 and 108:
94Applied Fracture MechanicsFigure
- Page 109 and 110:
96Applied Fracture MechanicsA good
- Page 111 and 112:
98Applied Fracture MechanicsThis ne
- Page 113 and 114:
100Applied Fracture MechanicsIn thi
- Page 115 and 116:
102Applied Fracture Mechanicsmateri
- Page 117 and 118:
104Applied Fracture Mechanics[9] Xi
- Page 119 and 120:
106Applied Fracture Mechanics[49] H
- Page 122 and 123:
Chapter 4Fracture of Dental Materia
- Page 124 and 125:
Fracture of Dental Materials 111ori
- Page 126 and 127:
Fracture of Dental Materials 113Fig
- Page 128 and 129:
Fracture of Dental Materials 115Fig
- Page 130 and 131:
Fracture of Dental Materials 117How
- Page 132 and 133:
Fracture of Dental Materials 119Cra
- Page 134 and 135:
Fracture of Dental Materials 121wit
- Page 136 and 137:
Fracture of Dental Materials 123is
- Page 138 and 139:
Fracture of Dental Materials 125cra
- Page 140 and 141:
Fracture of Dental Materials 127How
- Page 142 and 143:
Fracture of Dental Materials 129por
- Page 144 and 145:
Fracture of Dental Materials 131par
- Page 146 and 147:
Fracture of Dental Materials 133ind
- Page 148 and 149:
Fracture of Dental Materials 135the
- Page 150 and 151:
Fracture of Dental Materials 137at
- Page 152 and 153:
Fracture of Dental Materials 139[11
- Page 154 and 155:
Fracture of Dental Materials 141[50
- Page 156:
Fracture Mechanics Based Models of
- Page 159 and 160:
146 Applied Fracture Mechanics2 Wil
- Page 161 and 162:
148 Applied Fracture Mechanics4 Wil
- Page 163 and 164:
150 Applied Fracture Mechanics6 Wil
- Page 165 and 166:
152 Applied Fracture Mechanics8 Wil
- Page 167 and 168:
154 Applied Fracture Mechanics10 Wi
- Page 169 and 170:
156 Applied Fracture Mechanics12 Wi
- Page 171 and 172:
158 Applied Fracture Mechanics14 Wi
- Page 173 and 174: 160 Applied Fracture Mechanics16 Wi
- Page 175 and 176: 162 Applied Fracture Mechanics18 Wi
- Page 177 and 178: 164 Applied Fracture Mechanics20 Wi
- Page 179 and 180: 166 Applied Fracture Mechanics22 Wi
- Page 181 and 182: 168 Applied Fracture Mechanics24 Wi
- Page 183 and 184: 170 Applied Fracture Mechanics26 Wi
- Page 185 and 186: 172 Applied Fracture Mechanics28 Wi
- Page 187 and 188: 174 Applied Fracture Mechanics30 Wi
- Page 189 and 190: 176 Applied Fracture Mechanics32 Wi
- Page 191 and 192: 178Applied Fracture MechanicsThe em
- Page 193 and 194: 180Applied Fracture Mechanics0.2% p
- Page 195 and 196: 182Applied Fracture MechanicsFigure
- Page 197 and 198: 184Applied Fracture Mechanics3.3. P
- Page 199 and 200: 186Applied Fracture MechanicsFigure
- Page 201 and 202: 188Applied Fracture MechanicsMPa, a
- Page 203 and 204: 190Applied Fracture Mechanicsincrea
- Page 205 and 206: 192Applied Fracture Mechanicspropag
- Page 207 and 208: 194Applied Fracture MechanicsFigure
- Page 209 and 210: 196Applied Fracture MechanicsMuraka
- Page 211 and 212: 198Applied Fracture MechanicsForman
- Page 213 and 214: 200Applied Fracture MechanicsThe fa
- Page 215 and 216: 202Applied Fracture MechanicsFigure
- Page 217 and 218: 204Applied Fracture Mechanics10, 10
- Page 219 and 220: 206Applied Fracture Mechanicslong d
- Page 221 and 222: 208Applied Fracture Mechanicslike i
- Page 223: 210Applied Fracture MechanicsIt is
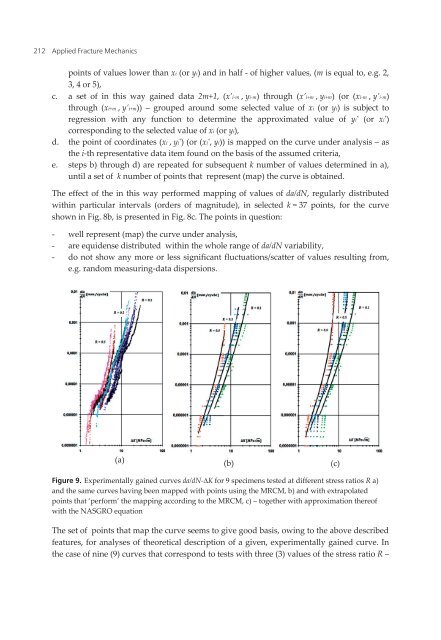
- Page 227 and 228: 214Applied Fracture Mechanics da
- Page 229 and 230: 216Applied Fracture MechanicsB1 B B
- Page 231 and 232: 218Applied Fracture MechanicsFigure
- Page 233 and 234: 220Applied Fracture Mechanics- inva
- Page 235 and 236: 222Applied Fracture MechanicsHaving
- Page 237 and 238: 224Applied Fracture MechanicsFigure
- Page 239 and 240: 226Applied Fracture MechanicsThe pr
- Page 241 and 242: 228Applied Fracture MechanicsWillen
- Page 243 and 244: 230Applied Fracture Mechanicsis spe
- Page 245 and 246: 232Applied Fracture MechanicsFatigu
- Page 247 and 248: 234Applied Fracture Mechanicsoften
- Page 249 and 250: 236Applied Fracture MechanicsProces
- Page 251 and 252: 238Applied Fracture MechanicsFigure
- Page 253 and 254: 240Applied Fracture MechanicsWith t
- Page 255 and 256: 242Applied Fracture MechanicsFigure
- Page 257 and 258: 244Applied Fracture Mechanicschrono
- Page 259 and 260: 246Applied Fracture Mechanics3.3. P
- Page 261 and 262: 248Applied Fracture MechanicsIn ord
- Page 263 and 264: 250Applied Fracture Mechanics aKI
- Page 265 and 266: 252Applied Fracture MechanicsG vs o
- Page 267 and 268: 254Applied Fracture Mechanicswalled
- Page 269 and 270: 256Applied Fracture Mechanicsmeasur
- Page 271 and 272: 258Applied Fracture Mechanics[23] P
- Page 273 and 274: 260Applied Fracture Mechanics[59] L
- Page 276 and 277:
Chapter 9Methodology for Pressurize
- Page 278 and 279:
Methodology for Pressurized Thermal
- Page 280 and 281:
Methodology for Pressurized Thermal
- Page 282 and 283:
Methodology for Pressurized Thermal
- Page 284 and 285:
Methodology for Pressurized Thermal
- Page 286 and 287:
Methodology for Pressurized Thermal
- Page 288 and 289:
Figure 8. Section of the RPVMethodo
- Page 290 and 291:
Methodology for Pressurized Thermal
- Page 292 and 293:
Methodology for Pressurized Thermal
- Page 294:
Developments in Civiland Mechanical
- Page 297 and 298:
284Applied Fracture Mechanicsthe th
- Page 299 and 300:
286Applied Fracture Mechanicsbody.
- Page 301 and 302:
288Applied Fracture MechanicsIn the
- Page 303 and 304:
290Applied Fracture Mechanicspower
- Page 305 and 306:
292Applied Fracture MechanicsThe ro
- Page 307 and 308:
294Applied Fracture Mechanics2,6pla
- Page 309 and 310:
296Applied Fracture Mechanicsmagnit
- Page 311 and 312:
298Applied Fracture Mechanics600500
- Page 313 and 314:
300Applied Fracture Mechanics600500
- Page 315 and 316:
302Applied Fracture MechanicsAs thi
- Page 317 and 318:
304Applied Fracture MechanicsFigure
- Page 319 and 320:
306Applied Fracture MechanicsEviden
- Page 321 and 322:
308Applied Fracture Mechanicsdrawn
- Page 323 and 324:
310Applied Fracture MechanicsRCC -
- Page 325 and 326:
312Applied Fracture Mechanicsturbin
- Page 327 and 328:
314Applied Fracture Mechanicssecond
- Page 329 and 330:
316Applied Fracture Mechanics3.2.5.
- Page 331 and 332:
318Applied Fracture MechanicsFigure
- Page 333 and 334:
320Applied Fracture MechanicsFigure
- Page 335 and 336:
322Applied Fracture Mechanicsand th
- Page 337 and 338:
324Applied Fracture Mechanicscalcul
- Page 339 and 340:
326Applied Fracture MechanicsStress
- Page 341 and 342:
328Applied Fracture Mechanics5. Bas
- Page 343 and 344:
330Applied Fracture MechanicsMoore,
- Page 345 and 346:
332Applied Fracture Mechanicsdevelo
- Page 347 and 348:
334Applied Fracture Mechanicsbasis
- Page 349 and 350:
336Applied Fracture Mechanics2.2.1.
- Page 351 and 352:
338Applied Fracture Mechanics4M 0.2
- Page 353 and 354:
340Applied Fracture Mechanics2.6. F
- Page 355 and 356:
342Applied Fracture Mechanicsin inc
- Page 357 and 358:
344Applied Fracture MechanicshP' (a
- Page 359 and 360:
346Applied Fracture Mechanics(that
- Page 361 and 362:
348Applied Fracture Mechanicsindepe
- Page 363 and 364:
350Applied Fracture MechanicsFigure
- Page 365 and 366:
352Applied Fracture MechanicsFigure
- Page 367 and 368:
354Applied Fracture Mechanicsfor an
- Page 369 and 370:
356Applied Fracture MechanicsHarris
- Page 371 and 372:
358Applied Fracture MechanicsZhang
- Page 373 and 374:
360Applied Fracture Mechanics2.1. I
- Page 375 and 376:
362Applied Fracture MechanicsCrack
- Page 377 and 378:
364Applied Fracture MechanicsASME s
- Page 379 and 380:
366Applied Fracture Mechanicswith t
- Page 381 and 382:
368Applied Fracture Mechanicsby shi
- Page 383 and 384:
370Applied Fracture MechanicsIinJi
- Page 385 and 386:
372Applied Fracture Mechanics32.82.
- Page 387 and 388:
374Applied Fracture MechanicsFigure
- Page 389 and 390:
376Applied Fracture MechanicsFrom t
- Page 391 and 392:
378Applied Fracture MechanicsJeong,
- Page 393:
380Applied Fracture MechanicsWeidma