

IST-4-027756 WINNER II D6.13.12 v1.0 Final CG “local area ...
IST-4-027756 WINNER II D6.13.12 v1.0 Final CG “local area ...
IST-4-027756 WINNER II D6.13.12 v1.0 Final CG “local area ...

You also want an ePaper? Increase the reach of your titles
YUMPU automatically turns print PDFs into web optimized ePapers that Google loves.
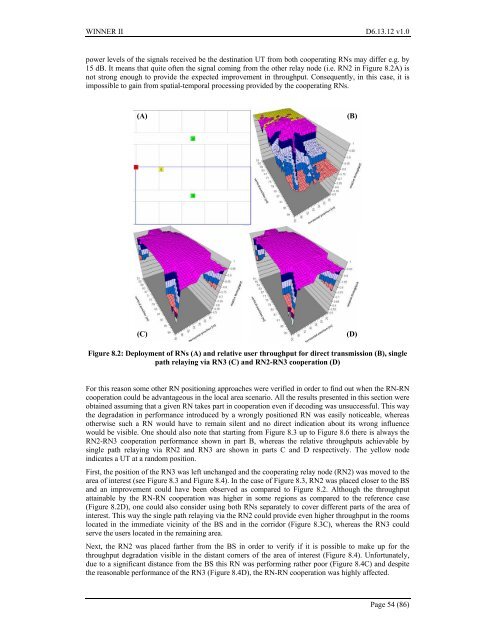
<strong>WINNER</strong> <strong>II</strong> <strong>D6.13.12</strong> <strong>v1.0</strong>power levels of the signals received be the destination UT from both cooperating RNs may differ e.g. by15 dB. It means that quite often the signal coming from the other relay node (i.e. RN2 in Figure 8.2A) isnot strong enough to provide the expected improvement in throughput. Consequently, in this case, it isimpossible to gain from spatial-temporal processing provided by the cooperating RNs.(A)(B)(C)(D)Figure 8.2: Deployment of RNs (A) and relative user throughput for direct transmission (B), singlepath relaying via RN3 (C) and RN2-RN3 cooperation (D)For this reason some other RN positioning approaches were verified in order to find out when the RN-RNcooperation could be advantageous in the local <strong>area</strong> scenario. All the results presented in this section wereobtained assuming that a given RN takes part in cooperation even if decoding was unsuccessful. This waythe degradation in performance introduced by a wrongly positioned RN was easily noticeable, whereasotherwise such a RN would have to remain silent and no direct indication about its wrong influencewould be visible. One should also note that starting from Figure 8.3 up to Figure 8.6 there is always theRN2-RN3 cooperation performance shown in part B, whereas the relative throughputs achievable bysingle path relaying via RN2 and RN3 are shown in parts C and D respectively. The yellow nodeindicates a UT at a random position.First, the position of the RN3 was left unchanged and the cooperating relay node (RN2) was moved to the<strong>area</strong> of interest (see Figure 8.3 and Figure 8.4). In the case of Figure 8.3, RN2 was placed closer to the BSand an improvement could have been observed as compared to Figure 8.2. Although the throughputattainable by the RN-RN cooperation was higher in some regions as compared to the reference case(Figure 8.2D), one could also consider using both RNs separately to cover different parts of the <strong>area</strong> ofinterest. This way the single path relaying via the RN2 could provide even higher throughput in the roomslocated in the immediate vicinity of the BS and in the corridor (Figure 8.3C), whereas the RN3 couldserve the users located in the remaining <strong>area</strong>.Next, the RN2 was placed farther from the BS in order to verify if it is possible to make up for thethroughput degradation visible in the distant corners of the <strong>area</strong> of interest (Figure 8.4). Unfortunately,due to a significant distance from the BS this RN was performing rather poor (Figure 8.4C) and despitethe reasonable performance of the RN3 (Figure 8.4D), the RN-RN cooperation was highly affected.Page 54 (86)


