Performance of Compressed-Air Foam with Foam Water Sprinklers ...
Performance of Compressed-Air Foam with Foam Water Sprinklers ...
Performance of Compressed-Air Foam with Foam Water Sprinklers ...

Create successful ePaper yourself
Turn your PDF publications into a flip-book with our unique Google optimized e-Paper software.
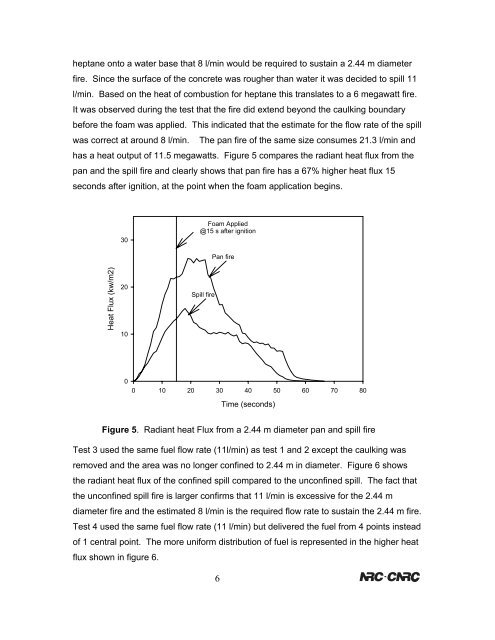
heptane onto a water base that 8 l/min would be required to sustain a 2.44 m diameterfire. Since the surface <strong>of</strong> the concrete was rougher than water it was decided to spill 11l/min. Based on the heat <strong>of</strong> combustion for heptane this translates to a 6 megawatt fire.It was observed during the test that the fire did extend beyond the caulking boundarybefore the foam was applied. This indicated that the estimate for the flow rate <strong>of</strong> the spillwas correct at around 8 l/min. The pan fire <strong>of</strong> the same size consumes 21.3 l/min andhas a heat output <strong>of</strong> 11.5 megawatts. Figure 5 compares the radiant heat flux from thepan and the spill fire and clearly shows that pan fire has a 67% higher heat flux 15seconds after ignition, at the point when the foam application begins.30<strong>Foam</strong> Applied@15 s after ignitionPan fireHeat Flux (kw/m2)2010Spill fire00 10 20 30 40 50 60 70 80Time (seconds)Figure 5. Radiant heat Flux from a 2.44 m diameter pan and spill fireTest 3 used the same fuel flow rate (11l/min) as test 1 and 2 except the caulking wasremoved and the area was no longer confined to 2.44 m in diameter. Figure 6 showsthe radiant heat flux <strong>of</strong> the confined spill compared to the unconfined spill. The fact thatthe unconfined spill fire is larger confirms that 11 l/min is excessive for the 2.44 mdiameter fire and the estimated 8 l/min is the required flow rate to sustain the 2.44 m fire.Test 4 used the same fuel flow rate (11 l/min) but delivered the fuel from 4 points instead<strong>of</strong> 1 central point. The more uniform distribution <strong>of</strong> fuel is represented in the higher heatflux shown in figure 6.6