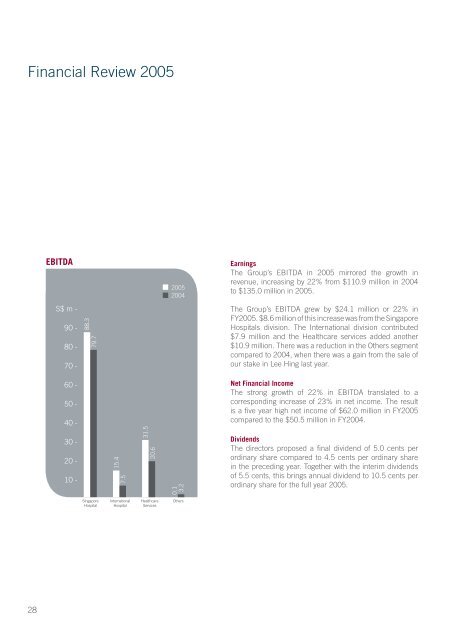
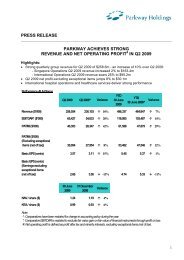
Financial Review <strong>2005</strong>EBITDA<strong>2005</strong>2004EarningsThe Group’s EBITDA in <strong>2005</strong> mirrored the growth inrevenue, increasing by 22% from $110.9 million in 2004to $135.0 million in <strong>2005</strong>.S$ m -90 -80 -70 -88.379.7The Group’s EBITDA grew by $24.1 million or 22% inFY<strong>2005</strong>. $8.6 million of this increase was from the SingaporeHospitals division. The International division contributed$7.9 million and the Healthcare services added another$10.9 million. There was a reduction in the Others segmentcompared to 2004, when there was a gain from the sale ofour stake in Lee Hing last year.60 -50 -40 -30 -20 -10 -15.47.531.520.60.13.2Net Financial IncomeThe strong growth of 22% in EBITDA translated to acorresponding increase of 23% in net income. The resultis a fi ve year high net income of $62.0 million in FY<strong>2005</strong>compared to the $50.5 million in FY2004.DividendsThe directors proposed a fi nal dividend of 5.0 cents perordinary share compared to 4.5 cents per ordinary sharein the preceding year. Together with the interim dividendsof 5.5 cents, this brings annual dividend to 10.5 cents perordinary share for the full year <strong>2005</strong>.SingaporeHospitalInternationalHospitalHealthcareServicesOthers28
Group Consolidated Statements<strong>2005</strong> 2004 # 2003 2002 2001$’ 000 $’ 000 $’ 000 $’ 000 $’ 000Profi t and Loss AccountRevenueHealthcare 547,221 405,614 344,743 325,096 344,775Others 1,750 2,218 3,905 12,463 12,357548,971 407,832 348,648 337,559 357,132Earnings before interest expense, tax, depreciationand amortisation (EBITDA) ~ 134,982 110,925 85,865 89,201 86,848% of revenue 24.6% 27.2% 24.6% 26.4% 24.3%Earnings before interest expense, taxand exceptional items (EBIT) 96,429 71,922 55,381 58,547 56,115% of revenue 17.6% 17.6% 15.9% 17.3% 15.7%Earnings after tax and minority interest but beforeexceptional items 61,969 50,463 33,608 33,301 24,891% of revenue 11.3% 12.4% 9.6% 9.9% 7.0%Net Profi t for the year 61,969 50,463 33,608 33,301 12,479% of revenue 11.3% 12.4% 9.6% 9.9% 3.5%Balance SheetTotal Assets 1,304,179 937,049 815,460 832,881 824,280Net Borrowings 336,114 192,951 233,853 242,645 217,874Total Shareholders’ Funds 415,517 425,027 430,500 427,970 411,107Profi tability Ratios (%):Return on Shareholders’ FundsBefore exceptional items 14.9 11.9 7.8 7.8 6.1After exceptional items 14.9 11.9 7.8 7.8 3.0Return on AssetsBefore exceptional items 4.8 5.4 4.1 4.0 3.0After exceptional items 4.8 5.4 4.1 4.0 1.5Gearing Ratio:Net debt equity ratio 0.81 0.45 0.54 0.57 0.53Per share Data:Earnings per share (S$)Before exceptional items 0.09 0.07 0.05 0.05 0.03After exceptional items 0.09 0.07 0.05 0.05 0.02Gross dividend (S$) + 0.105 0.09 0.06 0.05 0.03Net tangible asset backing per share (S$) 0.32 0.54 0.55 0.55 0.57Net asset value backing per share (S$) 0.57 0.59 0.60 0.59 0.57~ Earnings before exceptional items, exchange differences and share of results of associates.# Certain comparative fi gures in FY2004 have been restated for comparative purposes due to the adoption of the new and revised accounting standards that wereimplemented in <strong>2005</strong>.+ Gross dividend comprises interim dividend declared during the year and fi nal dividend proposed by directors in respect of that fi nancial year under review.29