Statement of Intent 2011-2014 - New Zealand Customs Service
Statement of Intent 2011-2014 - New Zealand Customs Service
Statement of Intent 2011-2014 - New Zealand Customs Service

You also want an ePaper? Increase the reach of your titles
YUMPU automatically turns print PDFs into web optimized ePapers that Google loves.
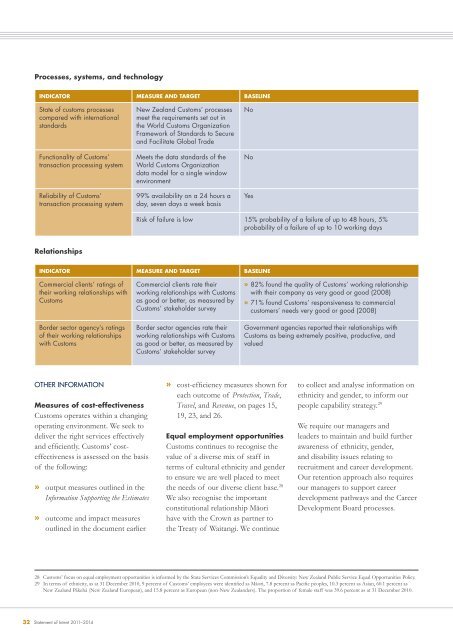
Processes, systems, and technologyINDICATOR MEASURE AND TARGET BASELINEState <strong>of</strong> customs processescompared with internationalstandardsFunctionality <strong>of</strong> <strong>Customs</strong>’transaction processing systemReliability <strong>of</strong> <strong>Customs</strong>’transaction processing system<strong>New</strong> <strong>Zealand</strong> <strong>Customs</strong>’ processesmeet the requirements set out inthe World <strong>Customs</strong> OrganizationFramework <strong>of</strong> Standards to Secureand Facilitate Global TradeMeets the data standards <strong>of</strong> theWorld <strong>Customs</strong> Organizationdata model for a single windowenvironment99% availability on a 24 hours aday, seven days a week basisNoNoYesRisk <strong>of</strong> failure is low 15% probability <strong>of</strong> a failure <strong>of</strong> up to 48 hours, 5%probability <strong>of</strong> a failure <strong>of</strong> up to 10 working daysRelationshipsINDICATOR MEASURE AND TARGET BASELINECommercial clients’ ratings <strong>of</strong>their working relationships with<strong>Customs</strong>Border sector agency’s ratings<strong>of</strong> their working relationshipswith <strong>Customs</strong>Commercial clients rate theirworking relationships with <strong>Customs</strong>as good or better, as measured by<strong>Customs</strong>’ stakeholder surveyBorder sector agencies rate theirworking relationships with <strong>Customs</strong>as good or better, as measured by<strong>Customs</strong>’ stakeholder survey» 82% found the quality <strong>of</strong> <strong>Customs</strong>’ working relationshipwith their company as very good or good (2008)» 71% found <strong>Customs</strong>’ responsiveness to commercialcustomers’ needs very good or good (2008)Government agencies reported their relationships with<strong>Customs</strong> as being extremely positive, productive, andvaluedOTHER INFORMATIONMeasures <strong>of</strong> cost-effectiveness<strong>Customs</strong> operates within a changingoperating environment. We seek todeliver the right services effectivelyand efficiently. <strong>Customs</strong>’ costeffectivenessis assessed on the basis<strong>of</strong> the following:»»output measures outlined in theInformation Supporting the Estimatesoutcome and impact measuresoutlined in the document earlier» cost-efficiency measures shown foreach outcome <strong>of</strong> Protection, Trade,Travel, and Revenue, on pages 15,19, 23, and 26.Equal employment opportunities<strong>Customs</strong> continues to recognise thevalue <strong>of</strong> a diverse mix <strong>of</strong> staff interms <strong>of</strong> cultural ethnicity and genderto ensure we are well placed to meetthe needs <strong>of</strong> our diverse client base. 28We also recognise the importantconstitutional relationship Māorihave with the Crown as partner tothe Treaty <strong>of</strong> Waitangi. We continueto collect and analyse information onethnicity and gender, to inform ourpeople capability strategy. 29We require our managers andleaders to maintain and build furtherawareness <strong>of</strong> ethnicity, gender,and disability issues relating torecruitment and career development.Our retention approach also requiresour managers to support careerdevelopment pathways and the CareerDevelopment Board processes.28 <strong>Customs</strong>’ focus on equal employment opportunities is informed by the State <strong>Service</strong>s Commission’s Equality and Diversity: <strong>New</strong> <strong>Zealand</strong> Public <strong>Service</strong> Equal Opportunities Policy.29 In terms <strong>of</strong> ethnicity, as at 31 December 2010, 9 percent <strong>of</strong> <strong>Customs</strong>’ employees were identified as Māori, 7.8 percent as Pacific peoples, 10.3 percent as Asian, 60.1 percent as<strong>New</strong> <strong>Zealand</strong> Pākehā (<strong>New</strong> <strong>Zealand</strong> European), and 15.8 percent as European (non-<strong>New</strong> <strong>Zealand</strong>ers). The proportion <strong>of</strong> female staff was 39.6 percent as at 31 December 2010.32 <strong>Statement</strong> <strong>of</strong> <strong>Intent</strong> <strong>2011</strong>–<strong>2014</strong>