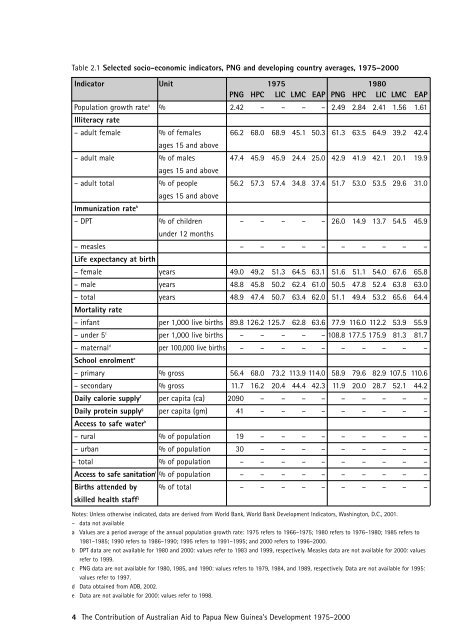
Table 2.1 Selected socio-economic indica<strong>to</strong>rs, <strong>PNG</strong> and developing country averages, 1975–2000Indica<strong>to</strong>r Unit 1975 1980<strong>PNG</strong> HPC LIC LMC EAP <strong>PNG</strong> HPC LIC LMC EAPPopulation growth rate a % 2.42 ––––2.49 2.84 2.41 1.56 1.61Illiteracy rate– adult female % of females 66.2 68.0 68.9 45.1 50.3 61.3 63.5 64.9 39.2 42.4ages 15 and above– adult male % of males 47.4 45.9 45.9 24.4 25.0 42.9 41.9 42.1 20.1 19.9ages 15 and above– adult <strong>to</strong>tal % of people 56.2 57.3 57.4 34.8 37.4 51.7 53.0 53.5 29.6 31.0ages 15 and aboveImmunization rate b–DPT % of children –––––26.0 14.9 13.7 54.5 45.9under 12 months–measles ––––––––––Life expectancy at birth– female years 49.0 49.2 51.3 64.5 63.1 51.6 51.1 54.0 67.6 65.8– male years 48.8 45.8 50.2 62.4 61.0 50.5 47.8 52.4 63.8 63.0– <strong>to</strong>tal years 48.9 47.4 50.7 63.4 62.0 51.1 49.4 53.2 65.6 64.4Mortality rate– infant per 1,000 live births 89.8 126.2 125.7 62.8 63.6 77.9 116.0 112.2 53.9 55.9– under 5 c per 1,000 live births –––––108.8 177.5 175.9 81.3 81.7– maternal d per 100,000 live births – – – – – – – – – –School enrolment e– primary % gross 56.4 68.0 73.2 113.9 114.0 58.9 79.6 82.9 107.5 110.6– secondary % gross 11.7 16.2 20.4 44.4 42.3 11.9 20.0 28.7 52.1 44.2Daily calorie supply f per capita (ca) 2090 –––––––––Daily protein supply g per capita (gm) 41 –––––––––Access <strong>to</strong> safe water h–rural % of population 19 ––––––––––urban % of population 30 ––––––––––<strong>to</strong>tal % of population ––––––––––Access <strong>to</strong> safe sanitation i % of population ––––––––––Births attended by % of <strong>to</strong>tal ––––––––––skilled health staff jNotes: Unless otherwise indicated, data are derived from World Bank, World Bank Development Indica<strong>to</strong>rs, Washing<strong>to</strong>n, D.C., 2001.–data not availablea Values are a period average of the annual population growth rate: 1975 refers <strong>to</strong> 1966–1975; 1980 refers <strong>to</strong> 1976–1980; 1985 refers <strong>to</strong>1981–1985; 1990 refers <strong>to</strong> 1986–1990; 1995 refers <strong>to</strong> 1991–1995; and 2000 refers <strong>to</strong> 1996–2000.b DPT data are not available for 1980 and 2000: values refer <strong>to</strong> 1983 and 1999, respectively. Measles data are not available for 2000: valuesrefer <strong>to</strong> 1999.c <strong>PNG</strong> data are not available for 1980, 1985, and 1990: values refers <strong>to</strong> 1979, 1984, and 1989, respectively. Data are not available for 1995:values refer <strong>to</strong> 1997.d Data obtained from ADB, 2002.e Data are not available for 2000: values refer <strong>to</strong> 1998.4 The Contribution of <strong>Australian</strong> <strong>Aid</strong> <strong>to</strong> Papua New Guinea’s Development 1975–2000
1985 1990 1995 2000<strong>PNG</strong> HPC LIC LMC EAP <strong>PNG</strong> HPC LIC LMC EAP <strong>PNG</strong> HPC LIC LMC EAP <strong>PNG</strong> HPC LIC LMC EAP2.64 2.66 2.28 1.56 1.55 2.52 2.73 2.28 1.63 1.67 2.58 2.52 2.05 1.23 1.37 2.56 2.44 1.97 1.01 1.1356.4 58.7 60.6 33.7 35.3 51.8 53.5 56.1 28.9 29.3 47.5 48.1 51.6 25.0 24.8 43.2 42.6 47.0 21.5 20.739.0 38.0 38.5 16.6 15.8 35.6 34.1 34.9 13.6 12.5 32.4 30.2 31.5 11.2 10.0 29.4 26.6 28.3 9.2 7.947.3 48.6 49.5 25.0 25.4 43.4 44.0 45.4 21.2 20.8 39.7 39.3 41.5 18.1 17.3 36.1 34.7 37.6 15.3 14.240.0 25.7 21.6 73.5 64.3 67.0 61.7 64.4 92.6 89.5 47.0 63.5 63.7 88.4 87.0 56.0 57.1 56.6 88.8 85.233.0 26.6 14.8 76.0 68.5 67.0 62.0 59.8 92.3 89.4 75.0 62.6 66.0 89.7 86.9 58.0 61.1 56.6 89.1 85.453.9 52.8 56.3 69.4 67.9 55.9 53.5 58.1 70.3 69.0 57.9 53.2 59.4 70.8 69.9 59.4 52.2 60.0 71.7 70.952.4 49.5 54.5 65.3 64.6 54.4 50.4 56.3 66.2 65.6 57.1 51.8 58.4 68.5 68.1 57.8 57.8 57.8 57.8 57.853.1 51.1 55.4 67.3 66.2 55.1 51.9 57.2 68.2 67.3 57.1 51.8 58.4 68.5 68.1 58.6 50.9 58.9 69.5 69.171.5 108.5 99.4 45.1 48.1 83.3 102.9 88.1 39.6 43.2 66.5 95.1 81.0 37.5 39.8 56.1 88.9 76.1 32.6 35.592.3 ––––107.7 140.8 127.1 49.8 55.0 82.4 153.6 117.4 44.3 48.5 74.7 153.9 114.9 40.6 44.7–––––930.0 ––––390.0 ––––370.0 ––––65.9 75.9 88.4114.7 118.5 71.9 73.5 88.5 116.3 120.1 80.4 76.8 91.0 112.0 115.0 84.9 82.0 95.8 106.4 107.011.5 20.8 34.5 49.4 41.6 12.4 20.8 37.1 55.7 48.1 14.0 23.0 40.2 66.9 62.9 22.3 28.0 42.3 63.0 62.0–––––2236 –2342 2741 ––––––––––––––––42 –56 71 –––––––––––– – – – –15 – –47 – – – – – –32 – – – ––––––95 –73 77 ––––––88 ––––– – – – – – – – – – 24 – – – – 41 – – – ––––––10.5 ––––25 ––––83 ––––43.0 ––––40.0 –43.3 ––33 –––––––––f Data are not available for 1975: <strong>PNG</strong> refers <strong>to</strong> 1971. 1971 data obtained from AIDAB, 1994, p.164. Data are not available for 1990: values refer <strong>to</strong> 1989.1989 data obtained from AIDAB, 1992, p.66.g Data are not available for 1975: <strong>PNG</strong> refers <strong>to</strong> 1971. 1971 data obtained from AIDAB, 1994, p.164. Data are not available for 1990: values refer <strong>to</strong> 1989.1989 data obtained from AIDAB, 1992, p.66.h Total data are not available for 2000: <strong>PNG</strong> refers <strong>to</strong> 2001. Rural and urban data are not available for 1975: values refer <strong>to</strong> 1971. Rural and urban data for1971 obtained from AIDAB, 1994, p.164. Rural and urban data for 1989 obtained from AIDAB, 1992, p.66. Total data for 1995 and 2000 obtained from ADB,2002, p.12.i The value for 1989 is an average of 1980–89. Data are not available for 2000: <strong>PNG</strong> refers <strong>to</strong> 2001. 1989 data obtained from World Bank, 1999b, p.24. 1995and 2000 data obtained from ADB, 2002, p.12. Note that World Bank, 1999a, p.178, records 83% in 1996, a marked divergence from the 1995 value.j <strong>PNG</strong> data are not available for 1985, 1990, and 1995: values refer <strong>to</strong> 1986, 1989 and 1994, respectively.The Contribution of <strong>Australian</strong> <strong>Aid</strong> <strong>to</strong> Papua New Guinea’s Development 1975–2000 5
- Page 5 and 6: BOXESBox 3.1 The Dutch Disease in P
- Page 7 and 8: FOREWORDAs part of a broader focus
- Page 11 and 12: programs to improve living standard
- Page 13 and 14: sector since independence, 65% has
- Page 15 and 16: 1 INTRODUCTIONThis report provides
- Page 17: Figure 2.1 Real GDP per capita in P
- Page 21 and 22: significant strain on the budget an
- Page 23 and 24: • Improved central coordination a
- Page 25 and 26: Connell (1998, pp. 311-2) highlight
- Page 27 and 28: y the successful mobilisation of cu
- Page 29 and 30: 3 INTERPRETING THE DEVELOPMENT ANDG
- Page 31 and 32: The estimated increase in private c
- Page 33 and 34: 3.4 Reconciling the Growth and Deve
- Page 35 and 36: 3.5 Implications for AidTo summaris
- Page 37 and 38: Although the precise extent of the
- Page 39 and 40: program saw a decline in the overal
- Page 41 and 42: criticism that the withdrawal of Au
- Page 43 and 44: Ministerial Forum found that real p
- Page 45 and 46: management for Papua New Guinea, ov
- Page 47 and 48: 5 THE IMPACT OF AUSTRALIAN AID INPA
- Page 49 and 50: • Improved retention rates at sch
- Page 51 and 52: • Achieved operational efficienci
- Page 53 and 54: policing are being introduced, alon
- Page 55 and 56: deliver community and public servic
- Page 57 and 58: BOX 5.5 HEALTH IMPACTS OF AUSTRALIA
- Page 59 and 60: also improved 24 , and there is evi
- Page 61 and 62: 5.5 Renewable ResourcesIn total, Au
- Page 63 and 64: Land Use Management• Established
- Page 65 and 66: New Guinea needs donor financing fo
- Page 67 and 68: only assist within the context of t
- Page 69 and 70:
Both within sectors and more broadl
- Page 71 and 72:
However, it seems reasonable to arg
- Page 73 and 74:
useful to document the findings of
- Page 75 and 76:
ANNEX A EVOLUTION OF AUSTRALIAN AID
- Page 77 and 78:
ANNEX B SECTOR BREAKDOWN OF AUSTRAL
- Page 79 and 80:
8 REFERENCESAhai, N., 1988, The Dev
- Page 81 and 82:
Garnaut, R., and Baxter, P., 1984,
- Page 83 and 84:
Growth Strategy, Final Report, prep