771D Quarry Truck
771D Quarry Truck
771D Quarry Truck

Create successful ePaper yourself
Turn your PDF publications into a flip-book with our unique Google optimized e-Paper software.
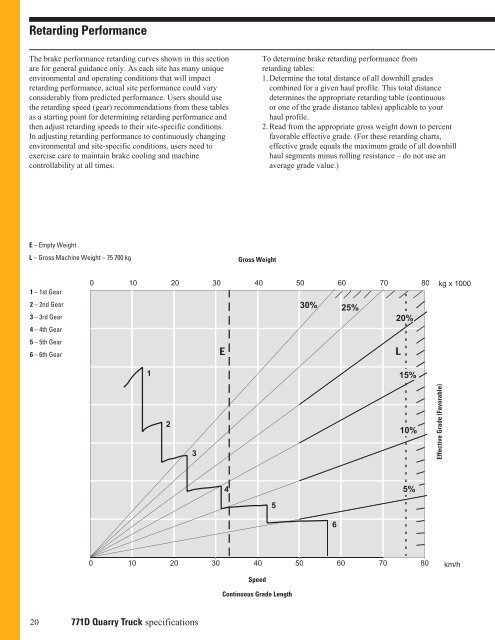
Retarding PerformanceThe brake performance retarding curves shown in this sectionare for general guidance only. As each site has many uniqueenvironmental and operating conditions that will impactretarding performance, actual site performance could varyconsiderably from predicted performance. Users should usethe retarding speed (gear) recommendations from these tablesas a starting point for determining retarding performance andthen adjust retarding speeds to their site-specific conditions.In adjusting retarding performance to continuously changingenvironmental and site-specific conditions, users need toexercise care to maintain brake cooling and machinecontrollability at all times.To determine brake retarding performance fromretarding tables:1. Determine the total distance of all downhill gradescombined for a given haul profile. This total distancedetermines the appropriate retarding table (continuousor one of the grade distance tables) applicable to yourhaul profile.2. Read from the appropriate gross weight down to percentfavorable effective grade. (For these retarding charts,effective grade equals the maximum grade of all downhillhaul segments minus rolling resistance – do not use anaverage grade value.)E – Empty WeightL – Gross Machine Weight – 75 700 kgGross Weight1 – 1st Gear2 – 2nd Gear3 – 3rd Gear4 – 4th Gear5 – 5th Gear6 – 6th Gear0 10 20 30 40 50 60 70 80 kg x 100030% 25%20%EL115%2310%Effective Grade (Favorable)45%560 10 20 30 40 50 60 70 80 km/hSpeedContinuous Grade Length20 <strong>771D</strong> <strong>Quarry</strong> <strong>Truck</strong> specifications