MILLENNIUM DEVELOPMENT GOALS ... - UNDP in Ukraine
MILLENNIUM DEVELOPMENT GOALS ... - UNDP in Ukraine
MILLENNIUM DEVELOPMENT GOALS ... - UNDP in Ukraine
- No tags were found...

You also want an ePaper? Increase the reach of your titles
YUMPU automatically turns print PDFs into web optimized ePapers that Google loves.
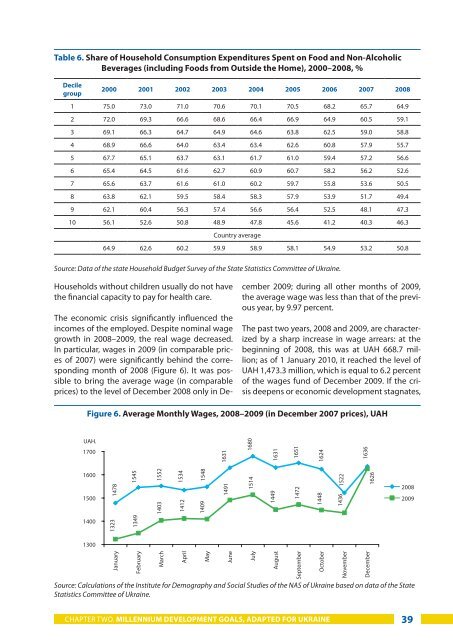
Table 6. Share of Household Consumption Expenditures Spent on Food and Non-AlcoholicBeverages (<strong>in</strong>clud<strong>in</strong>g Foods from Outside the Home), 2000–2008, %Decilegroup2000 2001 2002 2003 2004 2005 2006 2007 20081 75.0 73.0 71.0 70.6 70.1 70.5 68.2 65.7 64.92 72.0 69.3 66.6 68.6 66.4 66.9 64.9 60.5 59.13 69.1 66.3 64.7 64.9 64.6 63.8 62.5 59.0 58.84 68.9 66.6 64.0 63.4 63.4 62.6 60.8 57.9 55.75 67.7 65.1 63.7 63.1 61.7 61.0 59.4 57.2 56.66 65.4 64.5 61.6 62.7 60.9 60.7 58.2 56.2 52.67 65.6 63.7 61.6 61.0 60.2 59.7 55.8 53.6 50.58 63.8 62.1 59.5 58.4 58.3 57.9 53.9 51.7 49.49 62.1 60.4 56.3 57.4 56.6 56.4 52.5 48.1 47.310 56.1 52.6 50.8 48.9 47.8 45.6 41.2 40.3 46.3Country average64.9 62.6 60.2 59.9 58.9 58.1 54.9 53.2 50.8Source: Data of the state Household Budget Survey of the State Statistics Committee of Ukra<strong>in</strong>e.Households without children usually do not havethe f<strong>in</strong>ancial capacity to pay for health care.The economic crisis significantly <strong>in</strong>fluenced the<strong>in</strong>comes of the employed. Despite nom<strong>in</strong>al wagegrowth <strong>in</strong> 2008–2009, the real wage decreased.In particular, wages <strong>in</strong> 2009 (<strong>in</strong> comparable pricesof 2007) were significantly beh<strong>in</strong>d the correspond<strong>in</strong>gmonth of 2008 (Figure 6). It was possibleto br<strong>in</strong>g the average wage (<strong>in</strong> comparableprices) to the level of December 2008 only <strong>in</strong> December2009; dur<strong>in</strong>g all other months of 2009,the average wage was less than that of the previousyear, by 9.97 percent.The past two years, 2008 and 2009, are characterizedby a sharp <strong>in</strong>crease <strong>in</strong> wage arrears: at thebeg<strong>in</strong>n<strong>in</strong>g of 2008, this was at UAH 668.7 million;as of 1 January 2010, it reached the level ofUAH 1,473.3 million, which is equal to 6.2 percentof the wages fund of December 2009. If the crisisdeepens or economic development stagnates,Figure 6. Average Monthly Wages, 2008–2009 (<strong>in</strong> December 2007 prices), UAHUAH.1700163116801631165116241636160015001478154515521403153414121548140914911514144914721448152214361626200820091400132313491300JanuaryFebruaryMarchAprilMayJuneSource: Calculations of the Institute for Demography and Social Studies of the NAS of Ukra<strong>in</strong>e based on data of the StateStatistics Committee of Ukra<strong>in</strong>e.JulyAugustSeptemberOctoberNovemberDecemberCHAPTER TWO. <strong>MILLENNIUM</strong> <strong>DEVELOPMENT</strong> <strong>GOALS</strong>, ADAPTED FOR UKRAINE 39