07 CAFR cover FINAL.p65 - WMATA.com
07 CAFR cover FINAL.p65 - WMATA.com
07 CAFR cover FINAL.p65 - WMATA.com
- No tags were found...

Create successful ePaper yourself
Turn your PDF publications into a flip-book with our unique Google optimized e-Paper software.
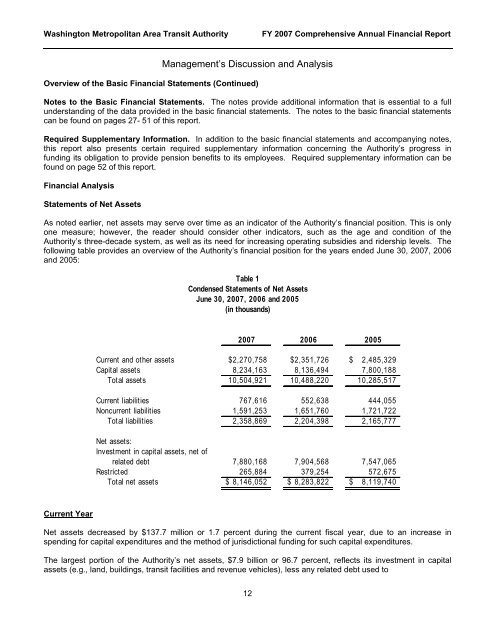
Washington Metropolitan Area Transit AuthorityFY 20<strong>07</strong> Comprehensive Annual Financial ReportManagement’s Discussion and AnalysisOverview of the Basic Financial Statements (Continued)Notes to the Basic Financial Statements. The notes provide additional information that is essential to a fullunderstanding of the data provided in the basic financial statements. The notes to the basic financial statementscan be found on pages 27- 51 of this report.Required Supplementary Information. In addition to the basic financial statements and ac<strong>com</strong>panying notes,this report also presents certain required supplementary information concerning the Authority’s progress infunding its obligation to provide pension benefits to its employees. Required supplementary information can befound on page 52 of this report.Financial AnalysisStatements of Net AssetsAs noted earlier, net assets may serve over time as an indicator of the Authority’s financial position. This is onlyone measure; however, the reader should consider other indicators, such as the age and condition of theAuthority’s three-decade system, as well as its need for increasing operating subsidies and ridership levels. Thefollowing table provides an overview of the Authority’s financial position for the years ended June 30, 20<strong>07</strong>, 2006and 2005:Table 1Condensed Statements of Net AssetsJune 30, 20<strong>07</strong>, 2006 and 2005(in thousands)20<strong>07</strong> 2006 2005Current and other assets $2,270,758 $2,351,726 $ 2,485,329Capital assets 8,234,163 8,136,494 7,800,188Total assets 10,504,921 10,488,220 10,285,517Current liabilities 767,616 552,638 444,055Noncurrent liabilities 1,591,253 1,651,760 1,721,722Total liabilities 2,358,869 2,204,398 2,165,777Net assets:Investment in capital assets, net ofrelated debt 7,880,168 7,904,568 7,547,065Restricted 265,884 379,254 572,675Total net assets $ 8,146,052 $ 8,283,822 $ 8,119,740Current YearNet assets decreased by $137.7 million or 1.7 percent during the current fiscal year, due to an increase inspending for capital expenditures and the method of jurisdictional funding for such capital expenditures.The largest portion of the Authority’s net assets, $7.9 billion or 96.7 percent, reflects its investment in capitalassets (e.g., land, buildings, transit facilities and revenue vehicles), less any related debt used to12