07 CAFR cover FINAL.p65 - WMATA.com
07 CAFR cover FINAL.p65 - WMATA.com
07 CAFR cover FINAL.p65 - WMATA.com
- No tags were found...

You also want an ePaper? Increase the reach of your titles
YUMPU automatically turns print PDFs into web optimized ePapers that Google loves.
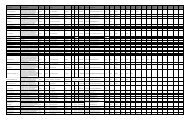
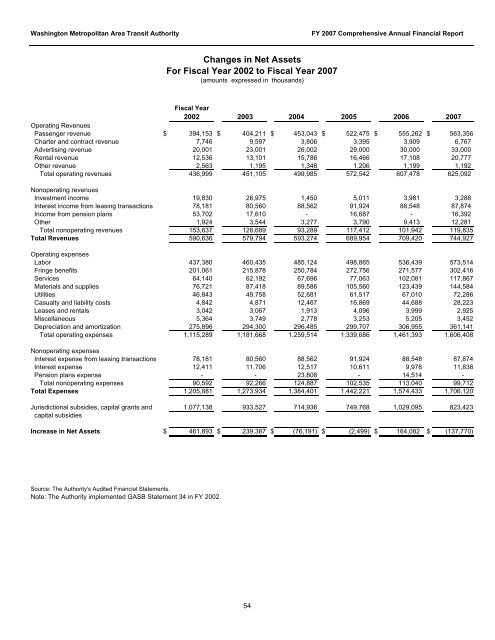
Washington Metropolitan Area Transit Authority FY 20<strong>07</strong> Comprehensive Annual Financial ReportChanges in Net AssetsFor Fiscal Year 2002 to Fiscal Year 20<strong>07</strong>(amounts expressed in thousands)Fiscal Year2002 2003 2004 2005 2006 20<strong>07</strong>Operating RevenuesPassenger revenue $ 394,153 $ 404,211 $ 453,043 $ 522,475 $ 555,262 $ 563,356Charter and contract revenue 7,746 9,597 3,806 3,395 3,909 6,767Advertising revenue 20,001 23,001 26,002 29,000 30,000 33,000Rental revenue 12,536 13,101 15,786 16,466 17,108 20,777Other revenue 2,563 1,195 1,348 1,206 1,199 1,192Total operating revenues 436,999 451,105 499,985 572,542 6<strong>07</strong>,478 625,092Nonoperating revenuesInvestment in<strong>com</strong>e 19,830 26,975 1,450 5,011 3,981 3,288Interest in<strong>com</strong>e from leasing transactions 78,181 80,560 88,562 91,924 88,548 87,874In<strong>com</strong>e from pension plans 53,702 17,610 - 16,687 - 16,392Other 1,924 3,544 3,277 3,790 9,413 12,281Total nonoperating revenues 153,637 128,689 93,289 117,412 101,942 119,835Total Revenues 590,636 579,794 593,274 689,954 709,420 744,927Operating expensesLabor 437,380 460,435 485,124 498,865 536,439 573,514Fringe benefits 201,061 215,878 250,784 272,756 271,577 302,416Services 64,140 62,192 67,696 77,063 102,081 117,867Materials and supplies 76,721 87,418 89,586 105,560 123,439 144,584Utilities 46,843 49,758 52,681 61,517 67,010 72,286Casualty and liability costs 4,842 4,871 12,467 16,869 44,688 28,223Leases and rentals 3,042 3,067 1,913 4,096 3,999 2,925Miscellaneous 5,364 3,749 2,778 3,253 5,205 3,452Depreciation and amortization 275,896 294,300 296,485 299,7<strong>07</strong> 306,955 361,141Total operating expenses 1,115,289 1,181,668 1,259,514 1,339,686 1,461,393 1,606,408Nonoperating expensesInterest expense from leasing transactions 78,181 80,560 88,562 91,924 88,548 87,874Interest expense 12,411 11,706 12,517 10,611 9,978 11,838Pension plans expense - - 23,808 - 14,514 -Total nonoperating expenses 90,592 92,266 124,887 102,535 113,040 99,712Total Expenses 1,205,881 1,273,934 1,384,401 1,442,221 1,574,433 1,706,120Jurisdictional subsidies, capital grants and 1,<strong>07</strong>7,138 933,527 714,936 749,768 1,029,095 823,423capital subsidiesIncrease in Net Assets $ 461,893 $ 239,387 $ (76,191) $ (2,499) $ 164,082 $ (137,770)Source: The Authority's Audited Financial Statements.Note: The Authority implemented GASB Statement 34 in FY 2002.54