07 CAFR cover FINAL.p65 - WMATA.com
07 CAFR cover FINAL.p65 - WMATA.com
07 CAFR cover FINAL.p65 - WMATA.com
- No tags were found...

You also want an ePaper? Increase the reach of your titles
YUMPU automatically turns print PDFs into web optimized ePapers that Google loves.
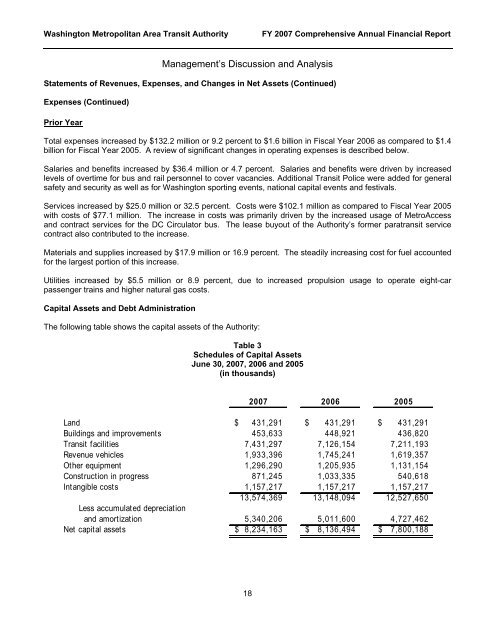
Washington Metropolitan Area Transit AuthorityFY 20<strong>07</strong> Comprehensive Annual Financial ReportManagement’s Discussion and AnalysisStatements of Revenues, Expenses, and Changes in Net Assets (Continued)Expenses (Continued)Prior YearTotal expenses increased by $132.2 million or 9.2 percent to $1.6 billion in Fiscal Year 2006 as <strong>com</strong>pared to $1.4billion for Fiscal Year 2005. A review of significant changes in operating expenses is described below.Salaries and benefits increased by $36.4 million or 4.7 percent. Salaries and benefits were driven by increasedlevels of overtime for bus and rail personnel to <strong>cover</strong> vacancies. Additional Transit Police were added for generalsafety and security as well as for Washington sporting events, national capital events and festivals.Services increased by $25.0 million or 32.5 percent. Costs were $102.1 million as <strong>com</strong>pared to Fiscal Year 2005with costs of $77.1 million. The increase in costs was primarily driven by the increased usage of MetroAccessand contract services for the DC Circulator bus. The lease buyout of the Authority’s former paratransit servicecontract also contributed to the increase.Materials and supplies increased by $17.9 million or 16.9 percent. The steadily increasing cost for fuel accountedfor the largest portion of this increase.Utilities increased by $5.5 million or 8.9 percent, due to increased propulsion usage to operate eight-carpassenger trains and higher natural gas costs.Capital Assets and Debt AdministrationThe following table shows the capital assets of the Authority:Table 3Schedules of Capital AssetsJune 30, 20<strong>07</strong>, 2006 and 2005(in thousands)20<strong>07</strong> 2006 2005Land $ 431,291 $ 431,291 $ 431,291Buildings and improvements 453,633 448,921 436,820Transit facilities 7,431,297 7,126,154 7,211,193Revenue vehicles 1,933,396 1,745,241 1,619,357Other equipment 1,296,290 1,205,935 1,131,154Construction in progress 871,245 1,033,335 540,618Intangible costs 1,157,217 1,157,217 1,157,21713,574,369 13,148,094 12,527,650Less accumulated depreciationand amortization 5,340,206 5,011,600 4,727,462Net capital assets $ 8,234,163 $ 8,136,494 $ 7,800,18818