Umrer Coalfield - Western Coalfields Limited
Umrer Coalfield - Western Coalfields Limited
Umrer Coalfield - Western Coalfields Limited

Create successful ePaper yourself
Turn your PDF publications into a flip-book with our unique Google optimized e-Paper software.
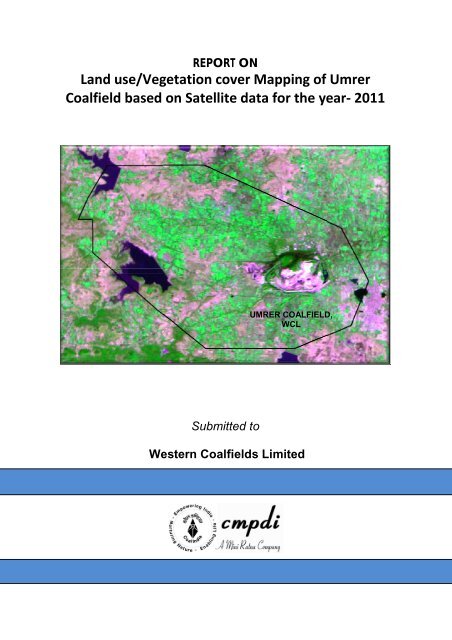
Land use/Vegetation cover Mapping of<strong>Umrer</strong> <strong>Coalfield</strong> based onSatellite data for the year‐ 2011.CMPDIMarch-2012Remote Sensing CellGeomatics DivisionCMPDI, RanchiRSC-561410027 (WCL)[ Page i of iv]
.CMPDIDocument Control Sheet(1) Job No. RSC/561410027(2) Publication Date March 2012(3) Number of Pages 32(4) Number of Figures 7(5) Number of Tables 6(6) Number of Plates 2(7) Title of Report Land use / Vegetation cover mapping of <strong>Umrer</strong><strong>Coalfield</strong> based on satellite data for the year 2011.(8) Aim of the Report To prepare Land use / Vegetation cover map of <strong>Umrer</strong><strong>Coalfield</strong> on 1:50000 scale for creating the geoenvironmentaldata base for land, vegetation cover,drainage, surface water, coal mines andinfrastructure.(9) Executing Unit Remote Sensing Cell,(10) User Agency <strong>Western</strong> <strong>Coalfield</strong>s Ltd.Geomatics DivisionCentral Mine Planning & Design Institute <strong>Limited</strong>,Gondwana Place, Kanke Road, Ranchi 834008(11) Authors A. Biswas (Senior Officer)Mr. N.P.Singh, GM(Remote sensing)Mr. V.K.Gupta, GM(Geomatics)(12) Security Restriction Restricted Circulation(13) No. of Copies 5(14) Distribution Statement OfficialRSC-561410027 (WCL)[ Page ii of iv]
.CMPDIIntroduction1.1 Project ReferenceChapter 1A road map was submitted by CMPDI to Coal India Ltd. for creating the geoenvironmentaldata base of all the 28 major coalfields and to assess the impactof coal mining and associated industrialization on land use and vegetation coverat regular interval of three years. Work order no. CIL/WBP/Env/2009/2428 dated29.12.2009; was issued by CIL to CMPDI for the above study. In pursuant to theabove work order, land use/vegetation cover mapping of <strong>Umrer</strong> <strong>Coalfield</strong> basedon satellite data was taken up to create the geo-environmental data base of thecoalfield using remote sensing data & GIS.1.2 ObjectivesThe objective of the present study is to prepare a regional land use andvegetation cover map of <strong>Umrer</strong> coalfield on 1:50,000 scale based on satellitedata of the year 2011, using digital image processing technique for creating thegeo-environmental data base in respect of land use, vegetation cover, drainage,mining area, infrastructure etc. and updation of database at regular interval ofthree years to assess the impact of coal mining and other industrial activities onland use and vegetation cover in the coalfield area.1.3 Location & Accessibility<strong>Umrer</strong> <strong>Coalfield</strong> is situated about 44 km south-east of Nagpur city and it is inNagpur district of Maharashtra state. The area is bounded between NorthLatitudes 20 0 49’ 36” to 20 0 55’ 07” and East Longitudes 79 0 10’ 18” to 79 0 19’ 32”and is covered by Survey of India (SOI) toposheet Nos. 55 P / 1 & 55 P / 5. TheRSC-561410027 (WCL)[Page 5 of 32]
.CMPDIlocation map and the incidence of study area on toposheets are shown in Figure1.1. The area extends for about 10 km in north-south direction and 16 km in eastwestdirection encompassing an area of about 110 sq. Km on RF 1:50000. Thiscoalfield holds a premier position in India for having a considerable share ofreserve of non-coking coal.<strong>Umrer</strong> coalfield is well connected by rail and road ways. <strong>Umrer</strong> is a railwaystation on the Nagpur-Nagbhir-Chanda Fort route which is a narrow gaugesection of the South-Eastern railway line. It is connected to Nagpur in the NWdirection and to Nagbhir in SE direction by a good road named MaharashtraMajor State Highway 9. Other major roads are also present.1.4 DrainageThe area has almost flat to gently undulating topography with fertile land. Thegeneral slope of the area is towards east to south east. The whole area is rich insurface water bodies, mainly rivers, nalas, reservoirs and ponds. The river Ambis the major channel here which is flowing from NW to E direction. It has othertributaries which have made this area fertile. The western part of the area ishaving one big reservoir named Makardhokra Reservoir. Saiki Lake is alsopresent in far NW part of the coalfield.1.5 Forest AreasThe SW part of this area is having a few forest lands which are mainly open forestsby nature.RSC-561410027 (WCL)[Page 6 of 32]
.CMPDIMaharashtraNFig. 1.1: Location Map of <strong>Umrer</strong> <strong>Coalfield</strong> in Maharashtra’s Nagpur districtRSC-561410027 (WCL) [ Page 7 of 32]
CMPDIRemote Sensing Concepts and Methodology2.1 Remote SensingChapter 2Remote sensing is thescience and art of obtaining information about an object orarea through the analysisof data acquired by adevice that is notinphysical contact withtheobject or area underinvestigation. The termremote sensing iscommonly restrictedtomethods that employelectro-magnetic energy(such as light, heat andradio waves) as themeans of detecting andmeasuring objectcharacteristics.All physical objects ontheearth surface continuouslyemit electromagneticradiation because of the oscillations of their atomic particles. Remote sensing islargely concerned with the measurement of electro-magnetic energy from theSUN, which is reflected, scattered or emitted by the objectson the surface of theRSC-561410027(WCL)[ Page 8 of 32]
CMPDIearth. Figure 2.1 schematically illustrate the generalised processes involved inelectromagnetic remote sensing of the earth resources.2.2 Electromagnetic SpectrumThe electromagnetic (EM) spectrum is the continuum of energy that ranges frommeters to nanometres in wavelength and travels at the speed of light. Differentobjects on the earth surface reflect different amounts of energy in variouswavelengths of the EM spectrum.Figure 2.2 shows the electromagnetic spectrum, which is divided on the basis ofwavelength into different regions that are described in Table 2.1. The EMspectrum ranges from the very short wavelengths of the gamma-ray region to thelong wavelengths of the radio region. The visible region (0.4-0.7µm wavelengths)occupies only a small portion of the entire EM spectrum.Energy reflected from the objects on the surface of the earth is recorded as afunction of wavelength. During daytime, the maximum amount of energy isreflected at 0.5µm wavelengths, which corresponds to the green band of thevisible region, and is called the reflected energy peak (Figure 2.2). The earth alsoRSC-561410027(WCL) [ Page 9 of 32]
CMPDIradiates energy both day and night, with the maximum energy 9.7µmwavelength. This radiant energy peak occurs in the thermal band of the IR region(Figure 2.2).RSC-561410027(WCL) [ Page 10 of 32]
CMPDITable 2.1 Electromagnetic spectral regionsRegion Wavelength RemarksGamma ray < 0.03 nm Incoming radiation is completely absorbed by theupper atmosphere and is not available for remotesensing.X-ray 0.03 to 3.00 nm Completely absorbed by atmosphere. Notemployed in remote sensing.Ultraviolet 0.03 to 0.40 µm Incoming wavelengths less than 0.3mm arecompletely absorbed by Ozone in the upperatmosphere.Photographic UVband0.30 to 0.40 µm Transmitted through atmosphere. Detectable withfilm and photo detectors, but atmosphericscattering is severe.Visible 0.40 to 0.70 µm Imaged with film and photo detectors. Includesreflected energy peak of earth at 0.5mm.Infrared 0.70 to 100.00 µm Interaction with matter varies with wavelength.Absorption bands separate atmospherictransmission windows.Reflected IR band 0.70 to 3.00 µm Reflected solar radiation that contains noinformation about thermal properties of materials.The band from 0.7-0.9mm is detectable with filmand is called the photographic IR band.Thermal IR band 3.008.00toto5.00 µm14.00 µmPrincipal atmospheric windows in the thermalregion. Images at these wavelengths areacquired by optical-mechanical scanners andspecial vediocon systems but not by film.Microwave 0.10 to 30.00 cm Longer wavelengths can penetrate clouds, fogand rain. Images may be acquired in the active orpassive mode.Radar 0.10 to 30.00 cm Active form of microwave remote sensing. Radarimages are acquired at various wavelengthbands.Radio > 30.00 cm Longest wavelength portion of electromagneticspectrum. Some classified radars with very longwavelength operate in this region.The earth's atmosphere absorbs energy in the gamma-ray, X-ray and most of theultraviolet (UV) region; therefore, these regions are not used for remote sensing.Details of these regions are shown in Figure 2.3. The horizontal axes showwavelength on a logarithmic scale; the vertical axes show percent atmospherictransmission of EM energy. Wavelength regions with high transmission are calledatmospheric windows and are used to acquire remote sensing data. Detectionand measurement of the recorded energy enables identification of surface objects(by their characteristic wavelength patterns or spectral signatures), bothfrom air-borne and space-borne platforms.RSC-561410027(WCL) [ Page 11 of 32]
CMPDI2.3 Scanning SystemThe sensing device in a remotely placed platform (aircraft/satellite) records EMradiation using a scanning system. In scanning system, a sensor, with a narrowfield of view is employed; this sweeps across the terrain to produce an image.The sensor receives electromagnetic energy radiated or reflected from the terrainand converts them into signal that is recorded as numerical data. In a remotesensing satellite, multiple arrays of linear sensors are used, with each arrayrecording simultaneously a separate band of EM energy. The array of sensorsemploys a spectrometer to disperse the incoming energy into a spectrum.Sensors (or detectors) are positioned to record specific wavelength bands ofenergy. The information received by the sensor is suitably manipulated andtransported back to the ground receiving station. The data are reconstructed onground into digital images. The digital image data on magnetic/optical mediaconsist of picture elements arranged in regular rows and columns. The positionof any picture element, pixel, is determined on a x-y co-ordinate system. Eachpixel has a numeric value, called digital number (DN) that records the intensity ofelectromagnetic energy measured for the ground resolution cell represented bythat pixel. The range of digital numbers in an image data is controlled by theradiometric resolution of the satellite’s sensor system. The digital image data arefurther processed to produce master images of the study area. By analysing thedigital data/imagery, digitally/visually, it is possible to detect, identify and classifyvarious objects and phenomenon on the earth surface.Remote sensing technique (airborne/satellite) in conjunction with traditional techniquesharbours in an efficient, speedy and cost-effective method for natural resourcemanagement due to its inherited capabilities of being multispectral, repetitiveand synoptic areal coverage. Generation of environmental 'Data Base' onland use, soil, forest, surface and subsurface water, topography and terrainRSC-561410027(WCL) [ Page 12 of 32]
CMPDIcharacteristics, settlement and transport network, etc., and their monitoring innear real - time is very useful for environmental management planning; this ispossible only with remote sensing data.2.4 Data SourceThe following data are used in the present study:• Primary DataRemote Sensing Satellite data viz. Resourcesat-IRS-P6/LISS-III of 2011having 23.5 m. spatial resolution was used in the present study. The rawdigital satellite data was obtained from NRSC, Hyderabad, on CD-ROMmedia.• Secondary DataSecondary (ancillary) and ground data constitute important baselineinformation in remote sensing, as they improve the interpretation accuracyand reliability of remotely sensed data by enabling verification of theinterpreted details and by supplementing it with the information that cannot beobtained directly from the remotely sensed data. For <strong>Umrer</strong> <strong>Coalfield</strong>, Surveyof India topo sheet no. 55 P/1 and 55 P/5 on RF 1:50000 as well as mapshowing details of location of area boundary, block boundary and roadsupplied by WCL were used in the study.2.5 Characteristics of Satellite/SensorThe basic properties of a satellite’s sensor system can be summarised as:(a) Spectral coverage/resolution, i.e., band locations/width; (b) spectraldimensionality: number of bands; (c) radiometric resolution: quantisation;(d) spatial resolution/instantaneous field of view or IFOV; and (e)RSC-561410027(WCL) [ Page 13 of 32]
CMPDItemporal resolution. Table 2.2 illustrates the basic properties ofResourcesat satellite/sensor that was used in the present study.Table 2.2 Characteristics of the satellite/sensor used in the present project workPlatform Sensor Spectral Bands in µm RadiometricResolutionRsource LISS-III B2 0.28 - 0.31 GreensatB3 0.25 - 0.38 Red(P6)B4 0.27 - 0.30 NIRB5 6.90 MIRNIR: Near Infra-Red MIR: Middle Infra-Red7-bit(128-grey levels)SpatialResolution23.5 m23.5 m23.5 m70.5 mTemporal CountryResolution24 days India2.6 Data ProcessingThe details of data processing carried out in the present study are shown inFigure 2.4. The processing methodology involves the following major steps:(a)(b)(c)(d)(e)(f)(g)Geometric correction, rectification and geo-referencing;Image enhancement;Training set selection;Signature generation and classification;Creation/overlay of vector database;Validation of classified image;Final thematic map preparation.RSC-561410027(WCL) [ Page 14 of 32]
CMPDIBasic DataData SourceSecondary DataIRS – P6 (LISSIII)Topographical Maps(Scale 1:50,000)Pre-processing, geometriccorrection, rectification& geo-referencingCreation of Vector Database(Drainage, Road Network,Coal block boundary)ImageEnhancementGeo-coded FCCGenerationTraining setIdentificationSignatureGenerationPre-FieldClassificationTraining SetRefinementValidation throughGround VerificationFailFinal Land Use/Cover MapPassIntegration ofThematicInformation on GISReportPreparationFig-2.4 –Methodology of Land Use/Vegetation Cover AnalysisRSC-561410027(WCL) [ Page 15 of 32]
CMPDIways. When transferring the Earth and its irregularities onto the plane surface ofa map, the following three factors are involved: (a) geoid (b) ellipsoid and (c)projection. Figure 2.5 illustrates the relationship between these three factors. Thegeoid is the rendition of the irregular spheroidal shape of the Earth; here thevariations in gravity are taken into account. The observation made on the geoid isthen transferred to a regular geometric reference surface, the ellipsoid. Finally,the geographical relationships of the ellipsoid (in 3-D form) are transformed intothe 2-D plane of a map by a transformation process called map projection. Asshown in Figure 2.5, the vast majority of projections are based upon cones,cylinders and planes.Fig 2.5 : Geoid – Ellipsoid – Projection RelationshipIn the present study, Polyconic projection along with Everest 1956 Ellipsoidalmodel was used so as to prepare the map compatible with the SoI topo-sheets.Polyconic projection is used in SoI topo-sheets as it is best suited for small -scale mapping and larger area as well as for areas with North-South orientation(viz. India). Maps prepared using these projections are a compromise of manyproperties; it is neither conformal perspective nor equal area. Distances, areasand shapes are true only along central meridian. Distortion increases away fromRSC-561410027(WCL) [ Page 17 of 32]
CMPDIcentral meridian. Image transformation from generic co-ordinate system to aprojected co-ordinate system was carried out using IMAGINE v.9.0 digital imageprocessing system.2.6.2 Image enhancementTo improve the interpretability of the raw data, image enhancement is necessary.Most of the digital image enhancement techniques are categorised as eitherpoint or local operations. Point operations modify the value of each pixel in theimage data independently. However, local operations modify the value of eachpixel based on brightness value of neighbouring pixels. Contrast manipulations/stretching technique based on local operation was applied on the image datausing IMAGINE s/w. The enhanced and geocoded FCC image of <strong>Umrer</strong> <strong>Coalfield</strong>is shown in Plate No. 1.2.6.3 Training set selectionThe image data were analysed based on the interpretation keys. These keys areevolved from certain fundamental image-elements such as tone/colour, size,shape, texture, pattern, location, association and shadow. Based on the imageelementsand other geo-technical elements like land form, drainage pattern andphysiography; training sets were selected/identified for each land use/coverclass. Field survey was carried out by taking selective traverses in order tocollect the ground information (or reference data) so that training sets areselected accurately in the image. This was intended to serve as an aid forclassification. Based on the variability of land use/cover condition and terraincharacteristics and accessibility, 250 points were selected to generate thetraining sets.RSC-561410027(WCL) [ Page 18 of 32]
CMPDI2.6.4 Signature generation and classificationImage classification was carried out using the maximum likelihood algorithm. Theclassification proceeds through the following steps: (a) calculation of statistics[i.e. signature generation] for the identified training areas, and (b) the decisionboundary of maximum probability based on the mean vector, variance,covariance and correlation matrix of the pixels.After evaluating the statistical parameters of the training sets, reliability test oftraining sets was conducted by measuring the statistical separation between theclasses that resulted from computing divergence matrix. The overall accuracy ofthe classification was finally assessed with reference to ground truth data. Theaerial extent of each land use class in the coalfield was determined usingERDAS IMAGINE s/w. The classified image for the year 2011 for <strong>Umrer</strong> <strong>Coalfield</strong>is shown in Plate No. 2.2.6.5 Creation/overlay of vector databasePlan showing coal block boundary is superimposed on the image as vector layerin the Arc GIS database. Road and drainage network are also digitised on ArcGIS database and superimposed on the classified image. Geo-environmentaldata base created on GIS platform to analyse the impact of mining on land useand vegetation cover at interval of three years.2.6.6 Validation of classified imageGround truth survey was carried out for validation of the interpreted results fromthe study area. Based on the validation, classification accuracy matrix wasprepared. The classification accuracy matrix is shown in Table 2.3.RSC-561410027(WCL) [ Page 19 of 32]
CMPDIClassification accuracy in case of urban settlements, plantation on backfill, quarryarea, waste lands and surface water Bodies were 100%. Classification accuracyin case of agriculture land lie between 90% to 100%. In case of open forest,plantation on ob and social forestry the classification accuracy varies from 80.0%to 90.0%. Classification accuracy for scrubs was 73.3% due to poor signatureseparability index. The overall classification accuracy is 90%.2.6.7 Final land use/vegetation cover map preparationFinal land use/vegetation cover map (Plate - 2) was generated on 1:50,000scale. Due to inconvenient size, map was printed on 1:90,000 scale using HPDesign jet 4500 Colour plotter and the same is enclosed in the report. A soft copyin .pdf format is also attached. .RSC-561410027(WCL) [ Page 20 of 32]
CMPDITable 2.3: Classification Accuracy Matrix for <strong>Umrer</strong> <strong>Coalfield</strong>Sl.No.Classesin theSatellite DataClassTotalObsrv.PointsLand use classes as observed in the field1 Urban Settlement C1 05 5C1 C2 C3 C4 C5 C6 C7 C8 C9 C102 Plantation on OB C2 10 8 1 13 Open Forest C3 10 1 8 14 Scrubs C4 10 1 1 7 15 Social Forestry C5 10 1 8 16 Agriculture Land C6 10 1 97 Waste Upland C7 10 108 Plantation on C8 10 10Backfill9 Quarry Area C9 10 1010 Water Bodies C10 10 10Total no. of observation points 110 05 10 10 10 10 10 10 10 10 10% of commission 00.0 20.0 20.0 30.0 20.0 10.0 0.0 0.0 0.0 0.0% of omission 00.0 20.0 20.0 30.0 20.0 10.0 0.0 0.0 0.0 0.0% of Classification Accuracy 100.0 80.0 80.0 70.0 80.0 90.0 100.0 100.0 100.0 100.0Overall Accuracy (%) 90.000RSC-561410027(WCL) [Page 21 of 32]
CMPDILand Use/ Cover MappingChapter 33.1 IntroductionLand is one of the most important natural resource on which all human activities arebased. Therefore, knowledge on different type of lands as well as its spatialdistribution in the form of map and statistical data is vital for its geospatial planningand management for optimal use of the land resources. In mining industry, the needfor information on land use/ vegetation cover pattern has gained importance due tothe all-round concern on environmental impact of mining. The information on landuse/ cover inventory that includes type, spatial distribution, aerial extent, location,rate and pattern of change of each category is of paramount importance forassessing the impact of coal mining on land use/ vegetation cover.Remote sensing data with its various spectral and spatial resolutions offercomprehensive and accurate information for mapping and monitoring of landuse/cover pattern, dynamics of changing pattern and trends over a period of time.By analysing the data of different cut-off dates, impact of coal mining on land useand vegetation cover can be determined.3.2 Land Use/Cover ClassificationThe array of information available on land use/cover requires arrangement orgrouping under a suitable framework in order to facilitate the creation of a landuse/cover database. Further, to accommodate the changing land use/cover pattern,it becomes essential to develop a standardised classification system that is not onlyRSC-561410027(WCL) [ Page 22 of 32 ]
CMPDIflexible in nomenclature and definition, but also capable of incorporating informationobtained from the satellite data and other different sources.The present framework of land use/cover classification has been primarily based onthe ‘Manual of Nationwide Land Use/ Land Cover Mapping Using SatelliteImagery’ developed by National Remote Sensing Agency, Hyderabad. Land usemap was prepared on the basis of image interpretation carried out based on thesatellite data for the year 2011 for <strong>Umrer</strong> coalfield and following land use/coverclasses are identified (Table 3).Table 3.1:Land use/cover classes identified in <strong>Umrer</strong> <strong>Coalfield</strong>Level -I1 Built-Up Land2 Agricultural Land3 Forest/Vegetation Cover4 Wasteland5 MiningLevel -II1.1 Urban1.2 Rural1.3 Industrial2.1 Crop Land2.2 Fallow Land3.1 Open Forest3.2 Scrub3.3 Plantation under Social Forestry3.4 Plantation on OB Dumps3.5 Plantation on Backfills4.1 Waste upland with/without scrubs5.1 Quarry Area5.2 Coal Dump5.3 Barren OB Dump5.4 Backfilled Area5.5 Water Filled Quarry5.6 Advanced Quarry Site6 Water bodies 6.1 River/Streams /Reservoir/PondsRSC-561410027(WCL) [ Page 23 of 32 ]
CMPDIFollowing maps are prepared on 1:50,000 scale :3. Plate No. 1: FCC (IRS – P6 LISS-III FCC data of <strong>Umrer</strong> coalfield of the year2011) with <strong>Coalfield</strong> boundary and other infrastructural details.4. Plate No. 2: Land use/Cover Map of <strong>Umrer</strong> <strong>Coalfield</strong> based on IRS-P6 LISS-IIIdata.3.3 Land use/cover AnalysisSatellite data of the year 2011 was processed using ERDAS IMAGINE 9.0 imageprocessing s/w in order to interpret the various land use/cover classes present inthe study area of <strong>Umrer</strong> <strong>Coalfield</strong> covering 110 sq. kms. Block wise area of eachland use/cover class for <strong>Umrer</strong> coalfield was calculated using ERDAS IMAGINE s/wand tabulated in Table 3.2. Distribution of various land use classes are shown in thePie Charts (Fig. 2.6). <strong>Umrer</strong> coalfield contains 4 coal blocks (identified till) whoseland use/cover classes are tabulated in Table 3.3.3.3.1 Settlement/ Built-up landAll the man-made constructions covering the land surface are included under thiscategory. Built-up land has been divided in to rural, urban and industrial classesbased on availability of infrastructure facilities. Total area of settlements in <strong>Umrer</strong>CF covers 2.33 km 2 (2.10%) Which are basically rural in nature (Refer Table 3.2).3.3.2 Vegetation cover AnalysisVegetation cover is an association of trees and other vegetation type capable ofproducing timber and other forest produce. It is also defined as the percentage ofsoil which is covered by green vegetation. Leaf area index (LAI) is an alternativeexpression of the term vegetation cover which gives the area of leaves in m 2corresponding to an area of one m 2 of ground. Primarily vegetation cover isclassified into the following three sub-classes based on crown density as permodified FAO-1963 (Food & Agricultural Organisation of United Nations) norms: (a)RSC-561410027(WCL) [ Page 24 of 32 ]
CMPDIdense forest (crown density more than 40%), (b) open/degraded forest (crowndensity between 10% to 40%), and (c) scrubs (crown density less than 10%). Theplantation that has been carried out on wasteland along the roadside and on theoverburden dumps is also included under vegetation cover as social forestry andplantation on backfilled/over-burden dumps respectively. The percentage ofvegetation cover shown in the analysis here are in terms of total land use coveronly. Details of area statistics of the vegetation cover in <strong>Umrer</strong> <strong>Coalfield</strong> area isgiven in Table 3.2.Analysis of data reveals that vegetation cover in <strong>Umrer</strong> <strong>Coalfield</strong> occupies an areaof 16.29 km 2 (14.71%). Out of which open forest cover occupies 1.33 km 2 (1.20%),scrub covers 13.57 km 2 (12.26%), social forestry 0.45 km 2 (0.41%), plantation onOB covers 0.10 km 2 (0.09%) and plantation on backfill covers 0.84 km 2 (0.76%) ofthe area.3.3.3 AgricultureLand primarily used for farming and production of food, fibre and other commercialand horticultural crops falls under this category. It includes crop land and fallowland. Crop lands are those agricultural lands where standing crop occurs on thedate of satellite imagery or land is used for agricultural purposes during any seasonof the year. Crops may be either kharif or rabi. Fallow lands are also agriculturalland which is taken up for cultivation but temporarily allowed to rest, un-cropped forone or more season.Analysis of data reveals that agriculture land in <strong>Umrer</strong> <strong>Coalfield</strong> area occupies anarea of 71.79 km 2 (64.84%). Out of which crop land is 24.96 km 2 (22.54%) andfallow land covers an area of 46.83 km 2 (42.30%).RSC-561410027(WCL) [ Page 25 of 32 ]
CMPDI3.3.4 MiningThe mining area includes the area of existing quarry, over burden, and water filledquarry area etc.Total mining area covers 5.04 km 2 (4.55%) out of which quarry covers 1.50 km 2(1.36%), coal dump covers 0.21 km 2 (0.19%), barren OB dump covers 0.38 km 2(0.34%), barren backfill covers 2.77 km 2 (2.50%), water filled quarry covers 0.11km 2 (0.10%) and advanced quarry site covers 0.06 km 2 (0.06%).3.3.5 WastelandWasteland is a degraded and under-utilised class of land that has deteriorated onaccount of natural causes or due to lack of appropriate water and soil management.Wasteland can result from inherent/imposed constraints such as location,environment, chemical and physical properties of the soil or financial or othermanagement constraints (NWDB, 1987). This also includes the sand body formedon the banks of the river owing to the non flow of water there.Analysis of data reveals that in <strong>Umrer</strong> <strong>Coalfield</strong>, wasteland covers an area of 8.30km 2 (7.50%).3.3.5 Surface Water bodiesAnalysis of data reveals that surface water bodies in <strong>Umrer</strong> CF covers an area of6.97 km 2 (6.29%).RSC-561410027(WCL) [ Page 26 of 32 ]
CMPDITable 3.2Land use/ cover pattern in <strong>Umrer</strong> <strong>Coalfield</strong> for the year 2011(Based on IRS-P6-LISS-III Data)Sl.Jan-11No.Land Use / Cover ClassesIRS – P6 / LISS – III DataLevel - I Level - II Km 2 %Settlement Rural 1.34 1.21Urban 0.73 0.66Industrial 0.25 0.23123456VegetationCoverMining AreaAgriculturalLandWaste LandWater BodySub-Total 2.33 2.10Open Forest 1.33 1.20Scrubs 13.57 12.26Social Forestry 0.45 0.41Plantation on OB 0.10 0.09Plantation on Backfill 0.84 0.76Sub – Total 16.29 14.71Coal Quarry 1.50 1.36Advanced Quarry Site 0.06 0.06Barren OB Dump 0.38 0.34Barren Backfill 2.77 2.50Coal Dump 0.21 0.19Water filled Quarry 0.11 0.10Sub – Total 5.04 4.55Crop Land 24.96 22.54Fallow Land 46.83 42.30Sub – Total 71.79 64.84Waste land with / withoutScrubs 8.30 7.50River, nallah, pond etc.6.97 6.29TOTAL 110.72 100.00RSC-561410027(WCL) [ Page 27 of 32 ]
CMPDITable 3.3 Block wise Area Statistics -<strong>Umrer</strong> CF(2011)Classes Area in km 2Level-I Level-II Makardhokra I Makardhokra IIMakardhokra MineExtn. I + III <strong>Umrer</strong> SouthUrban Settlements 0.00 0.08 0.00 0.32Rural Settlements 0.00 0.00 0.08 0.24SettlementsIndustrial Settlements 0.01 0.13 0.00 0.10Dense Forest 0.00 0.00 0.00 0.00Open Forest 0.00 0.35 0.00 0.04Scrubs 0.89 0.85 1.62 1.50Plantation on OB Dump 0.05 0.05 0.00 0.00Plantation on Backfill 0.05 0.61 0.00 0.19Vegetation Cover Social Forestry 0.00 0.03 0.00 0.24Crop land 1.61 0.53 7.47 1.16AgricultureFallow Land 3.24 0.75 8.76 2.21Waste Land 0.59 0.18 0.57 0.49Waste LandSand Body 0.00 0.00 0.00 0.00Coal Quarry 0.49 0.02 0.00 0.91Advance Quarry Site 0.00 0.00 0.00 0.06Mining AreaBarren OB Dump 0.10 0.17 0.00 0.03Barren Backfill 0.53 1.06 0.00 1.05Coal Dump 0.01 0.19 0.00 0.03Water Filled Quarry 0.05 0.00 0.00 0.06Water Body River/ Ponds 0.17 0.17 0.22 0.327.79 5.16 18.71 8.97RSC-561410027(WCL) [Page 28 of 32 ]
CMPDILanduse/Vegetation cover in <strong>Umrer</strong> CF (values in %)7.506.292.1014.714.5564. 84SettlementVegetation CoverMining AreaAgricultural LandWaste LandWater BodyFig. 2.6RSC-561410027(WCL)[ Page 29 of 32]
CMPDIPlate 1: FCC (Band 3, 2, 1) of <strong>Umrer</strong> CF based on IRS-P6 (LISS – III) Data of Year – 2011RSC-561410027(WCL) [ Page 30 of 32]
CMPDIPlate 2: LU / LC Map of <strong>Umrer</strong> CF based on IRS-1D (LISS-III) Data of Year 2011RSC-561410027(WCL) [ Page 31 of 32]
CMPDIChapter 4Conclusion & Recommendation4.1 ConclusionIn the present study, land use/ vegetation cover mapping has been carried out,based on IRS-P6/ LISS III satellite data in order to generate the geoenvironmentaldatabase on land use/vegetation cover in <strong>Umrer</strong> <strong>Coalfield</strong> formonitoring the impact of coal mining on land environment. Change analysis inland use pattern may helps in formulating the mitigation measures required, ifany.Study reveals that the settlements in the <strong>Umrer</strong> <strong>Coalfield</strong> are a mix of urban, ruraland industrial which covers an area of 2.33 km 2 (2.10%). Vegetation cover whichincludes open forests, scrubs, social forestry, plantation on ob dump and backfill,cover an area of 16.29 km 2 (14.71%). The study further indicates that totalagricultural land which includes crop and fallow land covers an area of 71.79 km 2(64.84%). Surface water bodies, mainly rivers, reservoir and ponds covered anarea of 6.97 km 2 (6.29%).4.2 RecommendationKeeping in view the sustainable development together with proposed coal mining inthe area, it is recommended that similar study should be carried out regularly atinterval of three years to monitor the land use and vegetation cover status andimpact of coal mining on land environment. In the south western side of <strong>Umrer</strong><strong>Coalfield</strong>, some parts of the forest area have become barren land, covered withscrubs due to deforestation or other biotic interferences. This can be restored backby planting of suitable trees that can be grown in the region.RSC-561410027(WCL) [ Page 32 of 32]
Central Mine Planning & Design Institute Ltd.(A Subsidiary of Coal India Ltd.)Gondwana Place, Kanke Road, Ranchi 834031, JharkhandPhone : (+91) 651 2230001, 2230002, 2230483, FAX (+91) 651 2231447, 2231851Wesite : www.cmpdi.co.in, Email : cmpdihq@cmpdi.co.in

![To [Name & Address of the Assured] Dear Mr./Ms.[______] Subject ...](https://img.yumpu.com/48378713/1/190x245/to-name-address-of-the-assured-dear-mr-ms-subject-.jpg?quality=85)