<strong>Report</strong> Date: 3/11/2014 3:32:42 PMPage : 16COUNTY: 01 ADAIRDISTNODISTRICT NAMESCHOOL DISTRICT NET VALUATIONSUSED IN 20<strong>13</strong>-2014 ESTIMATE OF NEEDSAS CERTIFIED TO STATE BOARD OF EQUALIZATIONVALUE OF VALUE OF VALUE OF VAL. LEVIES GENERAL FUND GEN. FUNDREAL PERSONAL PUBLIC TOTAL OF PER CAP GEN. BLDG SINK EXPENDITURE BALANCEPROPERTY PROPERTY SERVICES VALUATION RAW FUND FUND FUND JUNE 30, 20<strong>13</strong> JULY 1, 20<strong>13</strong>ADAC001 SKELLY 0 0 0 0 0 0.00 0.00 0.00 571,015 0C019 PEAVINE 2,468,302 528,764 253,308 3,250,374 23,858 35.00 5.00 0.00 1,611,734 68,708C022 MARYETTA 2,660,388 532,728 224,684 3,417,800 5,334 35.00 5.00 0.00 5,565,492 1,789,676C024 ROCKY MOUNTAIN 988,881 231,746 71,888 1,292,515 7,675 35.00 5.00 0.00 1,858,431 711,541C028 ZION 2,558,544 569,6<strong>13</strong> 253,341 3,381,498 10,734 35.00 5.00 0.00 2,458,476 481,251C029 DAHLONEGAH 494,611 857,749 <strong>13</strong>4,675 1,487,035 10,753 35.00 5.00 0.00 1,965,733 369,960C032 GREASY 1,206,277 239,925 179,600 1,625,802 38,290 35.00 5.00 0.00 798,315 249,645I004 WATTS 4,069,559 2,643,416 767,914 7,480,889 21,053 35.00 5.00 0.00 2,829,775 345,437I011 WESTVILLE 18,369,166 4,684,535 2,061,792 25,115,493 23,207 35.00 5.00 0.00 8,318,244 1,051,644I025 STILWELL 20,446,027 7,681,270 1,176,552 29,303,849 22,549 35.00 5.00 5.92 10,892,065 1,010,294I030 CAVE SPRINGS 1,143,705 210,397 519,711 1,873,8<strong>13</strong> 12,299 35.00 5.00 0.00 1,831,675 262,395TOTAL 54,405,460 18,180,143 5,643,465 78,229,068 17,862 - - - 38,700,955 6,340,552In addition to the levies shown, all schools receive another 4 mIlls.(County 4 mill levy-article x-section 9-constitution of Oklahoma)Includes all functions from OCAS expenditure data.COUNTY: 01 ADAIRDISTNODISTRICT NAMERAWADA*STATISTICAL AND FINANCIAL INFORMATIONTOTAL REVENUE RECEIVED BY SCHOOL DISTRICT<strong>2012</strong>-20<strong>13</strong>RAWADM*WGHTADM**LOCALANDCOUNTYSTATE REVENUES TOTAL REVENUESTATE STATE FEDERAL REVENUE PER CAPDEDICATED APPROPIATEDRECEIVED WGHT ADMC001 SKELLY 48.95 54.14 107.12 249,102 50,589 175,840 124,831 600,362 5,605C019 PEAVINE <strong>13</strong>6.24 143.53 323.77 299,062 52,430 994,217 328,955 1,674,664 5,172C022 MARYETTA 640.76 673.10 1,107.38 2,354,691 128,592 3,539,050 1,332,834 7,355,168 6,642C024 ROCKY MOUNTAIN 168.41 176.19 361.16 714,897 37,678 1,163,457 653,940 2,569,973 7,116C028 ZION 315.03 329.03 573.<strong>13</strong> 659,331 64,866 1,789,179 426,352 2,939,728 5,129C029 DAHLONEGAH <strong>13</strong>8.29 144.03 258.11 475,192 25,954 864,196 970,352 2,335,693 9,049C032 GREASY 42.46 46.48 <strong>13</strong>1.64 355,405 25,401 389,848 277,305 1,047,960 7,961I004 WATTS 355.33 380.53 630.48 763,432 221,010 1,718,865 471,682 3,174,989 5,036I011 WESTVILLE 1,082.24 1,150.12 1,848.32 1,876,149 644,824 5,179,356 1,636,978 9,337,307 5,052I025 STILWELL 1,299.55 1,394.07 2,337.34 2,512,707 768,<strong>13</strong>1 6,482,028 2,<strong>13</strong>9,494 11,902,359 5,092I030 CAVE SPRINGS 152.36 162.60 290.58 553,327 1<strong>13</strong>,264 891,234 536,246 2,094,070 7,207TOTAL 4,379.62 4,653.82 7,969.03 10,8<strong>13</strong>,296 2,<strong>13</strong>2,740 23,187,268 8,898,968 45,032,273 5,651State appropriated revenue for sponsoring district includes charter school flow through funds.* Taken from final audit <strong>2012</strong>-20<strong>13</strong>** Used <strong>2012</strong>-20<strong>13</strong> State Aid Formula to calculate foundation & salary incentive aidRevenue Per Capita is calculated by using the weighted ADM to better reflect the distribution of revenue by districtRemainder of information taken from school district Estimate of Needs and financial statement. Includes all Revenue Sources from OCAS.
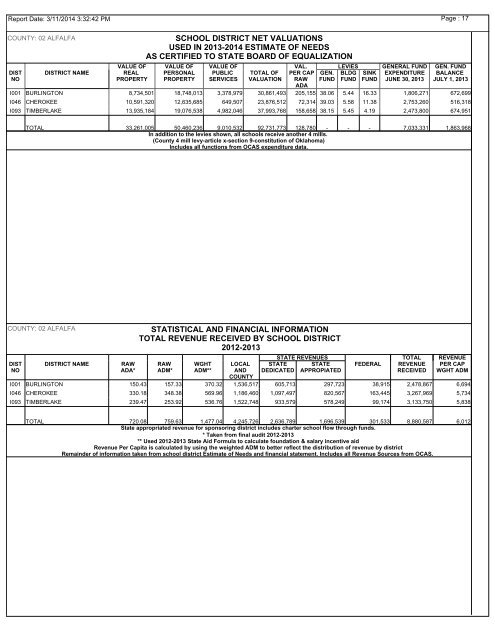
<strong>Report</strong> Date: 3/11/2014 3:32:42 PMPage : 17COUNTY: 02 ALFALFADISTNODISTRICT NAMESCHOOL DISTRICT NET VALUATIONSUSED IN 20<strong>13</strong>-2014 ESTIMATE OF NEEDSAS CERTIFIED TO STATE BOARD OF EQUALIZATIONVALUE OF VALUE OF VALUE OF VAL. LEVIES GENERAL FUND GEN. FUNDREAL PERSONAL PUBLIC TOTAL OF PER CAP GEN. BLDG SINK EXPENDITURE BALANCEPROPERTY PROPERTY SERVICES VALUATION RAW FUND FUND FUND JUNE 30, 20<strong>13</strong> JULY 1, 20<strong>13</strong>ADAI001 BURLINGTON 8,734,501 18,748,0<strong>13</strong> 3,378,979 30,861,493 205,155 38.06 5.44 16.33 1,806,271 672,699I046 CHEROKEE 10,591,320 12,635,685 649,507 23,876,512 72,314 39.03 5.58 11.38 2,753,260 516,318I093 TIMBERLAKE <strong>13</strong>,935,184 19,076,538 4,982,046 37,993,768 158,658 38.15 5.45 4.19 2,473,800 674,951TOTAL 33,261,005 50,460,236 9,010,532 92,731,773 128,780 - - - 7,033,331 1,863,968In addition to the levies shown, all schools receive another 4 mIlls.(County 4 mill levy-article x-section 9-constitution of Oklahoma)Includes all functions from OCAS expenditure data.COUNTY: 02 ALFALFADISTNODISTRICT NAMERAWADA*STATISTICAL AND FINANCIAL INFORMATIONTOTAL REVENUE RECEIVED BY SCHOOL DISTRICT<strong>2012</strong>-20<strong>13</strong>RAWADM*WGHTADM**LOCALANDCOUNTYSTATE REVENUES TOTAL REVENUESTATE STATE FEDERAL REVENUE PER CAPDEDICATED APPROPIATEDRECEIVED WGHT ADMI001 BURLINGTON 150.43 157.33 370.32 1,536,517 605,7<strong>13</strong> 297,723 38,915 2,478,867 6,694I046 CHEROKEE 330.18 348.38 569.96 1,186,460 1,097,497 820,567 163,445 3,267,969 5,734I093 TIMBERLAKE 239.47 253.92 536.76 1,522,748 933,579 578,249 99,174 3,<strong>13</strong>3,750 5,838TOTAL 720.08 759.63 1,477.04 4,245,726 2,636,789 1,696,539 301,533 8,880,587 6,012State appropriated revenue for sponsoring district includes charter school flow through funds.* Taken from final audit <strong>2012</strong>-20<strong>13</strong>** Used <strong>2012</strong>-20<strong>13</strong> State Aid Formula to calculate foundation & salary incentive aidRevenue Per Capita is calculated by using the weighted ADM to better reflect the distribution of revenue by districtRemainder of information taken from school district Estimate of Needs and financial statement. Includes all Revenue Sources from OCAS.